Fig. 1.
Download original image
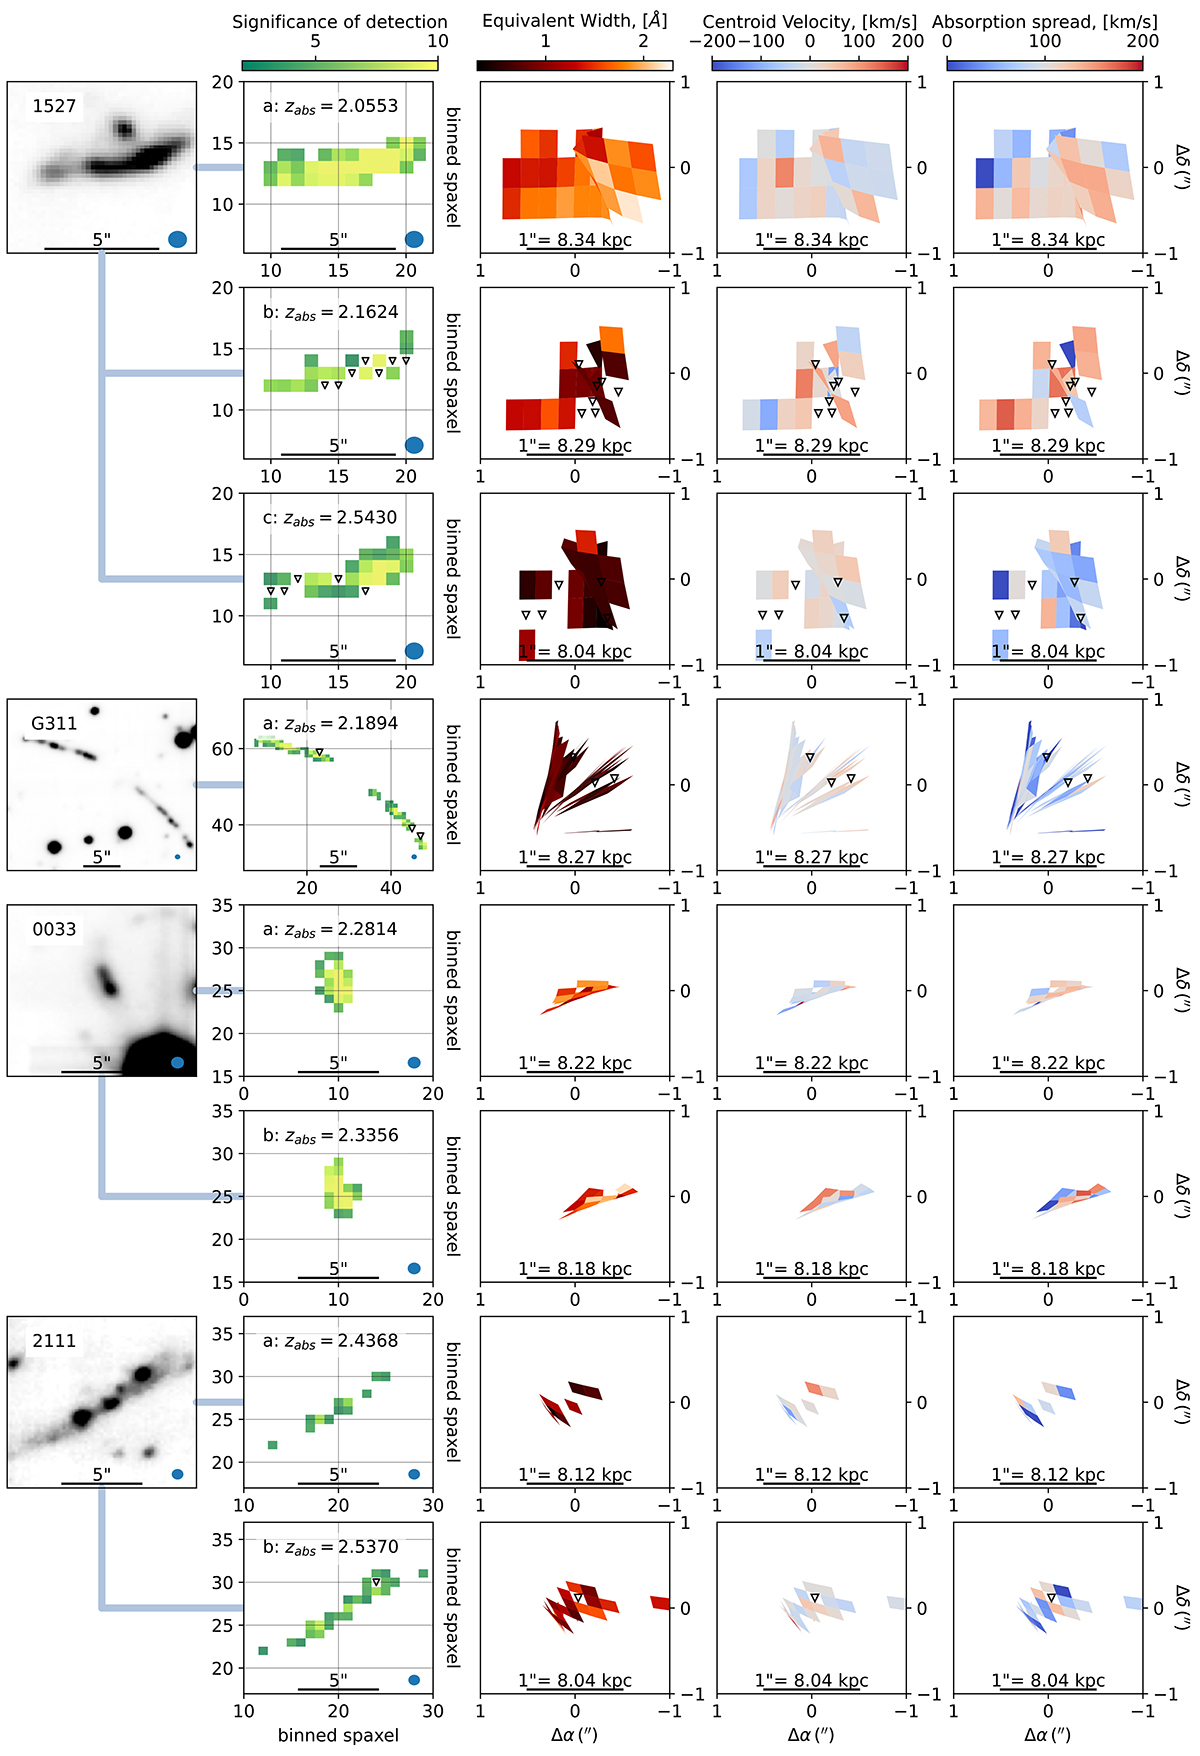
MUSE arc images and C IV system maps. Columns from left to right: Column (1): White-image stamps of the gravitational arcs. Column (2): ![]() -binned spaxels with C IV detections, colored according to their significance (Sect. 3.2). Spaxel coordinates as in Figs. A.1–A.8. In both columns, the PSF is represented by the lower-right circle. Columns (3), (4), and (5): Absorber-plane reconstructed maps of equivalent width (W01548), velocity, and absorption spread, respectively. In all panels, the scale is indicated. In Columns (2)–(5), the triangles indicate W0 ≤ 0.2 Å (2-σ) non-detections.
-binned spaxels with C IV detections, colored according to their significance (Sect. 3.2). Spaxel coordinates as in Figs. A.1–A.8. In both columns, the PSF is represented by the lower-right circle. Columns (3), (4), and (5): Absorber-plane reconstructed maps of equivalent width (W01548), velocity, and absorption spread, respectively. In all panels, the scale is indicated. In Columns (2)–(5), the triangles indicate W0 ≤ 0.2 Å (2-σ) non-detections.
Current usage metrics show cumulative count of Article Views (full-text article views including HTML views, PDF and ePub downloads, according to the available data) and Abstracts Views on Vision4Press platform.
Data correspond to usage on the plateform after 2015. The current usage metrics is available 48-96 hours after online publication and is updated daily on week days.
Initial download of the metrics may take a while.