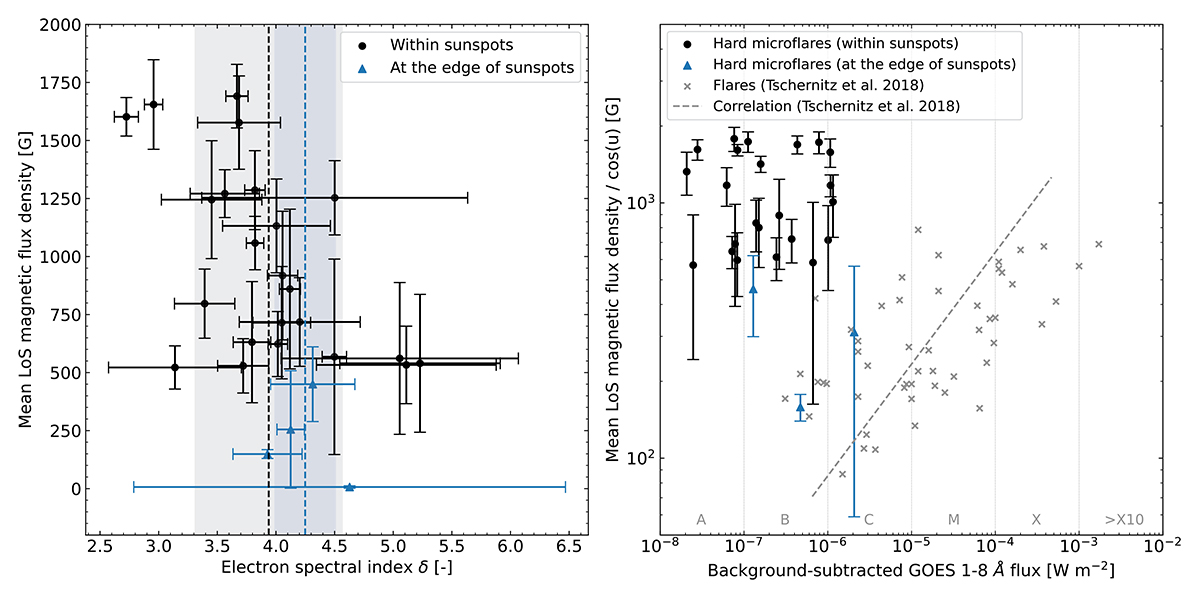
Fig. 9.
Download original image
Analysis of the photospheric LoS magnetic flux density of the flare footpoint located within or at the edge of the sunspot. Left: Absolute value of the mean LoS magnetic flux density as a function of the electron spectral index. Black dots represent events with the footpoint within the sunspot, while blue triangles represent those at the edge of the sunspot. Vertical lines indicate the mean electron spectral indices, with the shaded areas representing its standard deviation. Right: Absolute value of the mean LoS magnetic flux density against the background-subtracted GOES 1−8° SXR flux. The gray crosses and the dashed gray correlation curve are derived from Tschernitz et al. (2018, Figure 9). To be consistent with Tschernitz et al. (2018), in this plot we multiplied the mean LoS magnetic flux density by 1/cos(u), with u the angular distance from disk center of the flare location.
Current usage metrics show cumulative count of Article Views (full-text article views including HTML views, PDF and ePub downloads, according to the available data) and Abstracts Views on Vision4Press platform.
Data correspond to usage on the plateform after 2015. The current usage metrics is available 48-96 hours after online publication and is updated daily on week days.
Initial download of the metrics may take a while.