Fig. 7.
Download original image
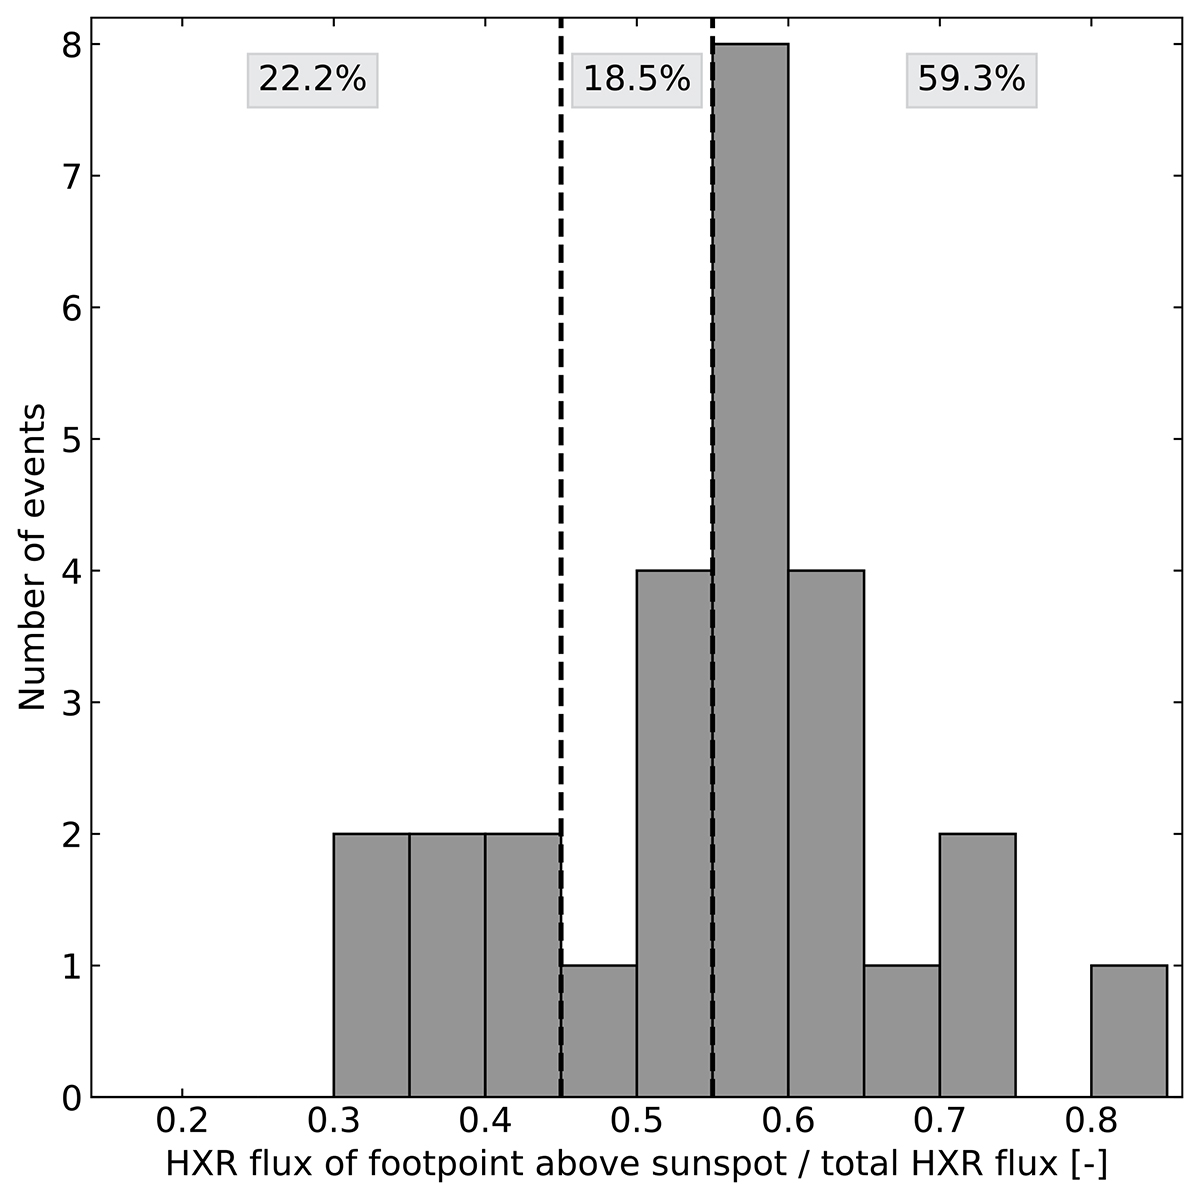
For the events with two HXR footpoints, this figure shows the histogram of the HXR flux coming from the footpoint above the sunspot relative to the total flux of the two HXR sources. Values above 0.5 on the horizontal axis mean that the flux is higher in the footpoint directly rooted within the sunspot, and vice versa for values below 0.5. By taking into account the error on the flux estimation, events with values between 0.45 and 0.55 (interval defined by the vertical dashed lines) are considered to have similar HXR fluxes in the footpoints. Of all the events with two footpoints, 59.3% have a stronger HXR flux in the footpoint rooted directly within the sunspot, 18.5% have similar fluxes, and 22.2% have a stronger HXR flux in the footpoint outside the sunspot.
Current usage metrics show cumulative count of Article Views (full-text article views including HTML views, PDF and ePub downloads, according to the available data) and Abstracts Views on Vision4Press platform.
Data correspond to usage on the plateform after 2015. The current usage metrics is available 48-96 hours after online publication and is updated daily on week days.
Initial download of the metrics may take a while.