Fig. 6.
Download original image
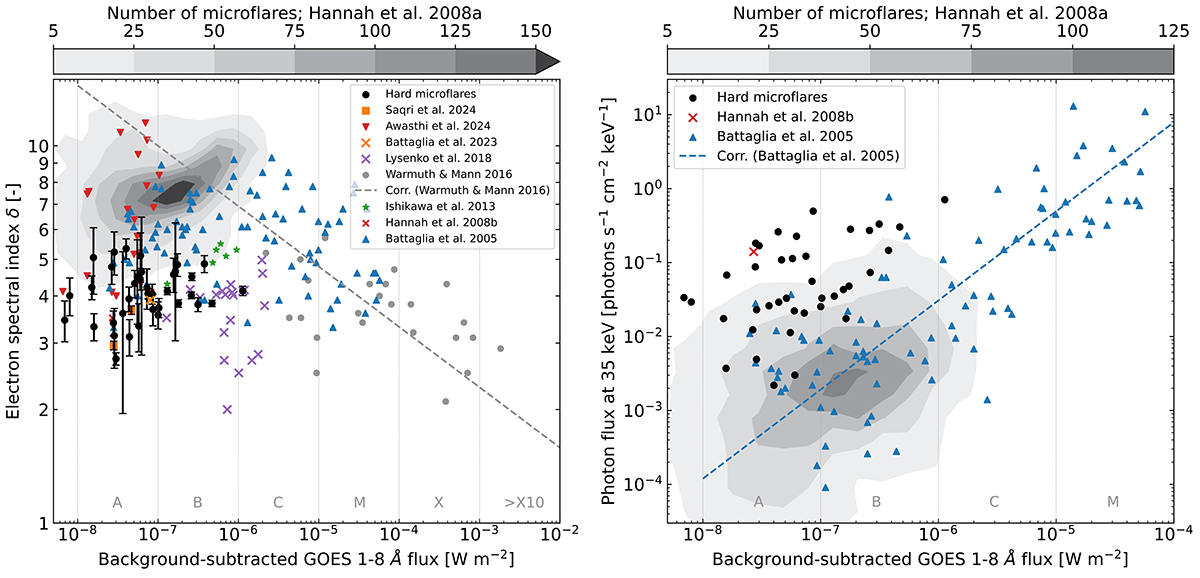
Comparison of the HXR spectral parameters of the hard microflares with events reported in the literature. Left: Electron spectral index δ as a function of the background-subtracted GOES 1−8 Å SXR flux. Black circles represent the hard microflares considered in this paper. As a reference, we report studies of general flare and microflare samples (Warmuth & Mann 2016b; Hannah et al. 2008a; Battaglia et al. 2005), and studies that included microflares with hard spectra (Saqri et al. 2024; Awasthi et al. 2024; Battaglia et al. 2023; Lysenko et al. 2018; Ishikawa et al. 2013; Hannah et al. 2008b). These studies are detailed in the legend. The gray contour levels correspond to the RHESSI microflare study by Hannah et al. (2008a). The gray dashed line represents the correlation curve deduced by Warmuth & Mann (2016b) from the observations of flares above the GOES C1 level. Right: HXR photon flux at 35 keV plotted against the background-subtracted GOES 1−8 Å SXR flux. Black dots represent the hard microflares. The blue triangles and the blue dashed curve are taken from Battaglia et al. (2005), while the red cross is from Hannah et al. (2008b). The gray contour levels again refer to the RHESSI microflare study by Hannah et al. (2008a).
Current usage metrics show cumulative count of Article Views (full-text article views including HTML views, PDF and ePub downloads, according to the available data) and Abstracts Views on Vision4Press platform.
Data correspond to usage on the plateform after 2015. The current usage metrics is available 48-96 hours after online publication and is updated daily on week days.
Initial download of the metrics may take a while.