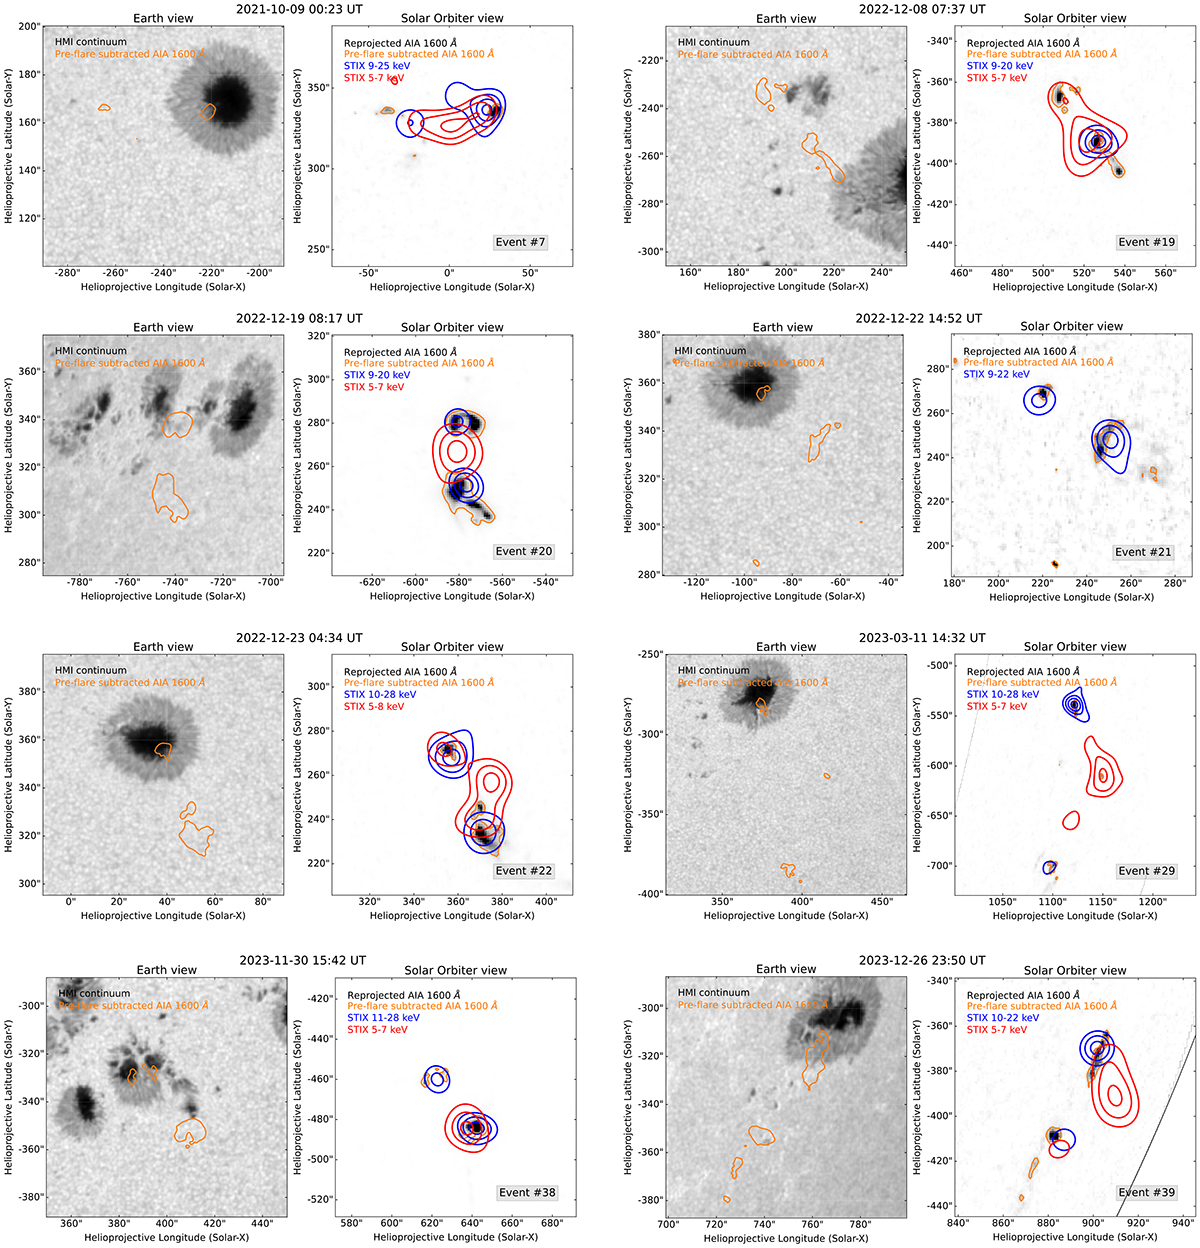
Fig. 4.
Download original image
Solar Orbiter/STIX HXR images of eight hard microflares. For each event, the left panel displays the SDO/HMI intensitygram and the pre-flare subtracted SDO/AIA 1600 Å contours (orange) from the Earth’s perspective. The right panel shows the SDO/AIA 1600 Å image closer to the nonthermal peak time reprojected to the Solar Orbiter view, with orange the reprojected pre-flare subtracted SDO/AIA 1600 Å contours. The STIX images are displayed as red (thermal emission) and blue (nonthermal emission) contours. The event number is displayed in the bottom-right corner.
Current usage metrics show cumulative count of Article Views (full-text article views including HTML views, PDF and ePub downloads, according to the available data) and Abstracts Views on Vision4Press platform.
Data correspond to usage on the plateform after 2015. The current usage metrics is available 48-96 hours after online publication and is updated daily on week days.
Initial download of the metrics may take a while.