Fig. 3.

Download original image
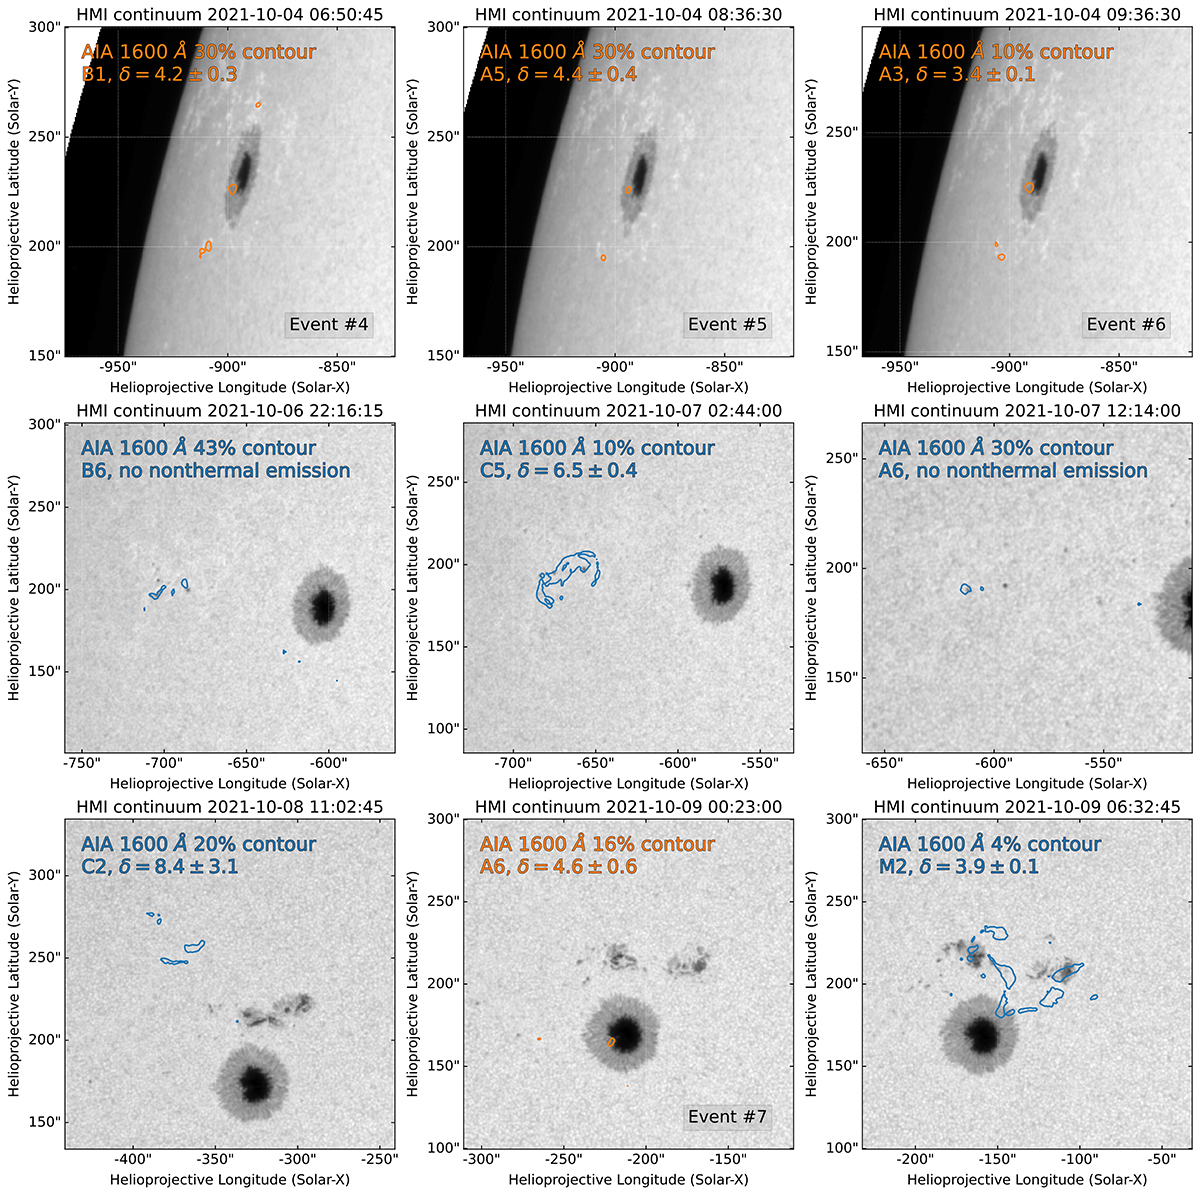
Flare ribbon location of various types of flares (standard microflares, hard microflares, and a medium-size flare) that occurred within AR12882. The orange contours represent the flare ribbons identified in the AIA 1600 Å images of the hard microflares, while the blue contours represent all other events. The intensity map from SDO/HMI is plotted in the background. The legend includes the percentage of the AIA 1600 Å contour used, the GOES class, and the electron spectral index δ. This figure clearly shows that hard microflares are rooted in sunspots (umbra or penumbra), while standard microflares, which have a soft spectrum or a total lack of nonthermal emission, are located far from sunspots.
Current usage metrics show cumulative count of Article Views (full-text article views including HTML views, PDF and ePub downloads, according to the available data) and Abstracts Views on Vision4Press platform.
Data correspond to usage on the plateform after 2015. The current usage metrics is available 48-96 hours after online publication and is updated daily on week days.
Initial download of the metrics may take a while.


