Fig. 2.
Download original image
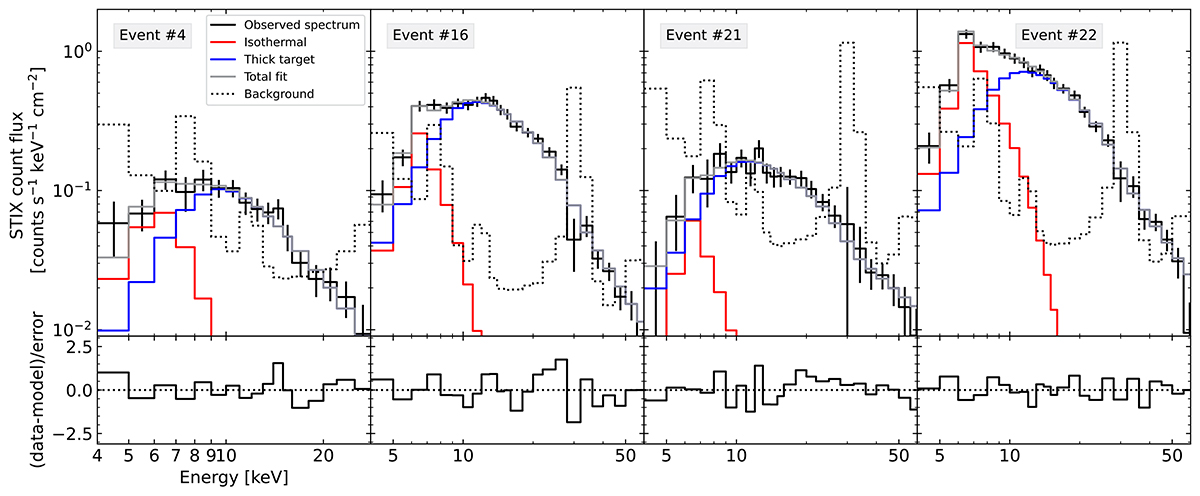
STIX spectra for the same events shown in Fig. 1. The solid black line illustrates the observed, background-subtracted flare spectra, while the dashed black lines display the background. The thermal and nonthermal models are represented by the red and blue curves, respectively. The sum of the two models is shown as a gray line. Beneath each spectrum, the residuals are provided, which are calculated by subtracting the total fit from the data and normalizing the result by the error bar.
Current usage metrics show cumulative count of Article Views (full-text article views including HTML views, PDF and ePub downloads, according to the available data) and Abstracts Views on Vision4Press platform.
Data correspond to usage on the plateform after 2015. The current usage metrics is available 48-96 hours after online publication and is updated daily on week days.
Initial download of the metrics may take a while.