Fig. A.1.
Download original image
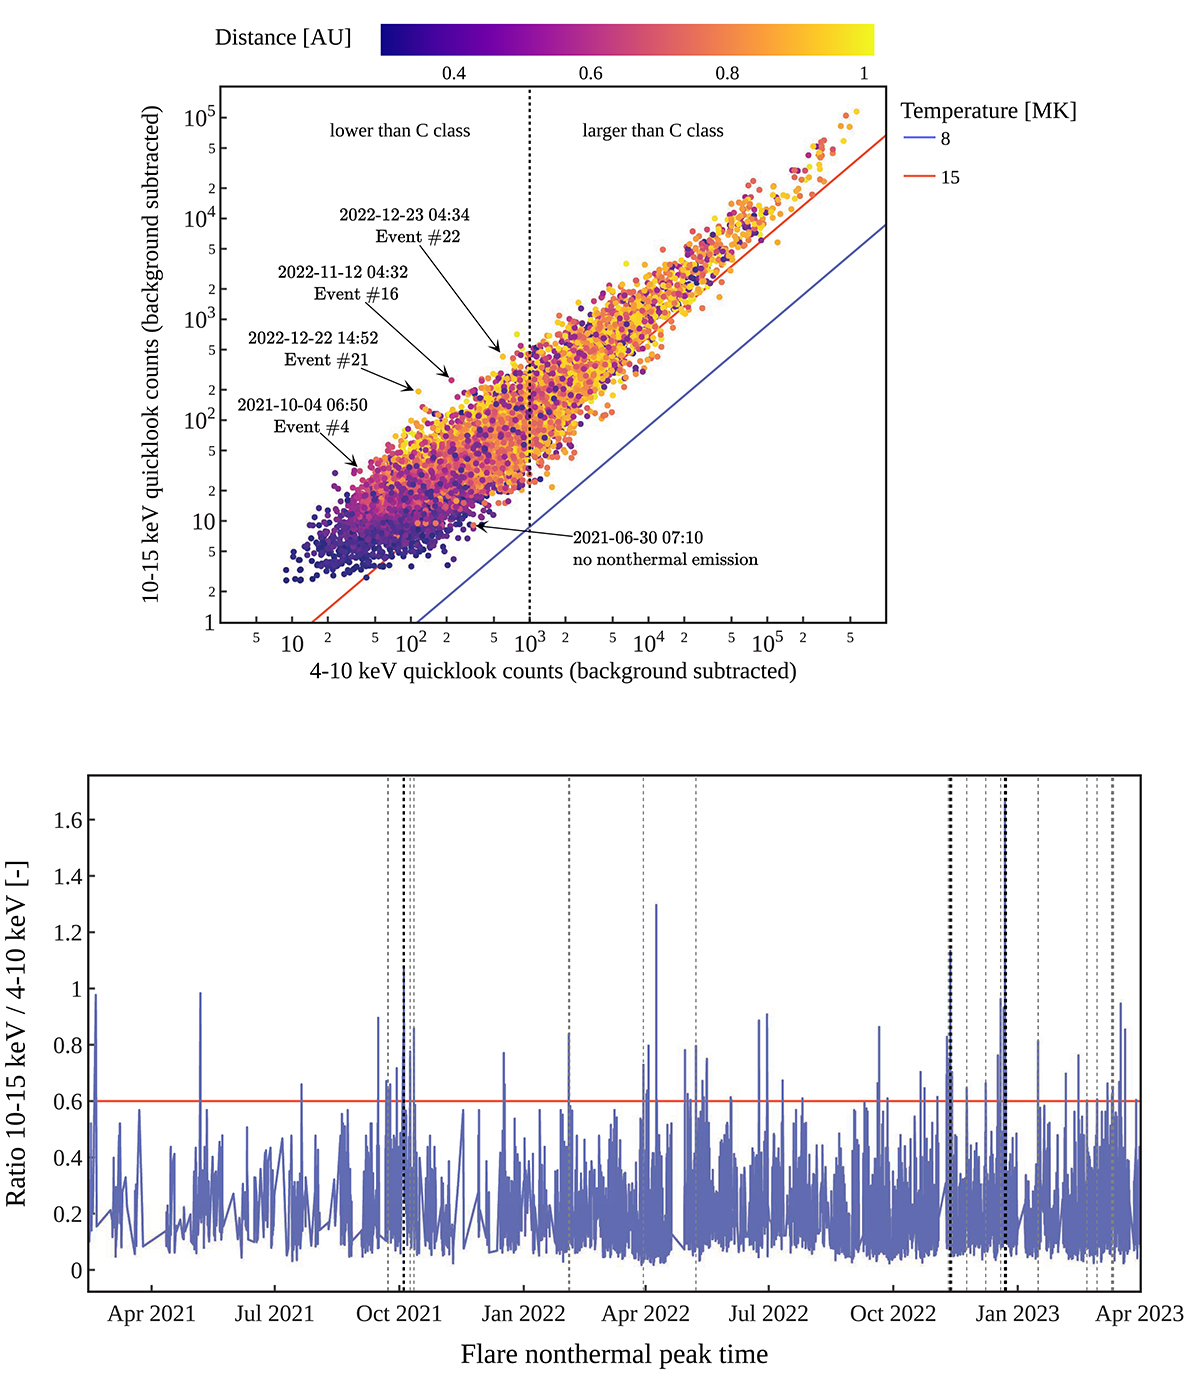
Summary of the event selection of the hard microflares. (Top) Scatter plot of the 10-15 keV STIX quicklook background-subtracted counts against the 4-10 keV quicklook background-subtracted counts at the nonthermal peak, for all flares from February 2021 to April 2023. All counts have been scaled to 1 AU. The color code refers to the Solar Orbiter distance to the Sun at the time of the observation. The blue and red lines show the expected STIX quicklook counts in the case of flares with a purely isothermal component of 8 MK and 15 MK temperature, respectively. In the scatter plot, we highlighted the same events as shown in Figs. 1 and 2. We can clearly observe how hard microflares cluster on the upper part of the cloud. (Bottom) Ratio between the 10-15 keV to 4-10 keV quicklook curves as function of date, from February 2021 to April 2023. The hard microflares clearly stand out as spikes. The horizontal red line indicates the chosen threshold of 0.6 to identify hard microflares. The vertical dashed gray lines mark the events selected for this statistical analysis and the vertical dashed black lines highlight the same four hard microflares as in the scatter plot.
Current usage metrics show cumulative count of Article Views (full-text article views including HTML views, PDF and ePub downloads, according to the available data) and Abstracts Views on Vision4Press platform.
Data correspond to usage on the plateform after 2015. The current usage metrics is available 48-96 hours after online publication and is updated daily on week days.
Initial download of the metrics may take a while.