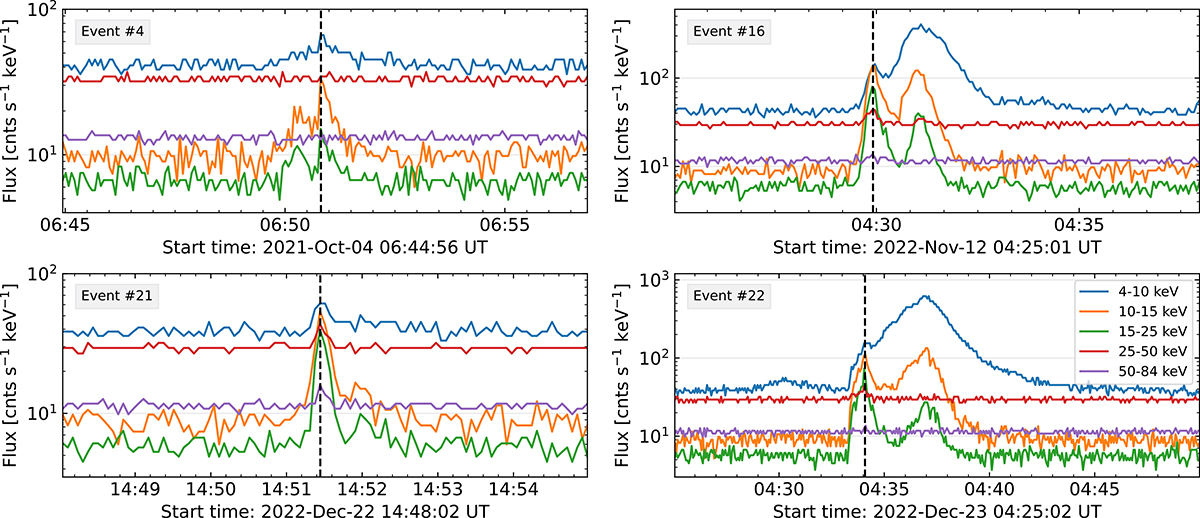
Fig. 1.
Download original image
STIX quicklook time profiles of four representative hard microflares from our sample. The energy range of the different curves is indicated in the legend located in the bottom right panel. The background-subtracted GOES classes for these events are A2 (event #4), B4 (event #16), A8 (event #21), and C1 (event #22), respectively. The vertical black dashed line represents the nonthermal peak time.
Current usage metrics show cumulative count of Article Views (full-text article views including HTML views, PDF and ePub downloads, according to the available data) and Abstracts Views on Vision4Press platform.
Data correspond to usage on the plateform after 2015. The current usage metrics is available 48-96 hours after online publication and is updated daily on week days.
Initial download of the metrics may take a while.