Fig. A.2.
Download original image
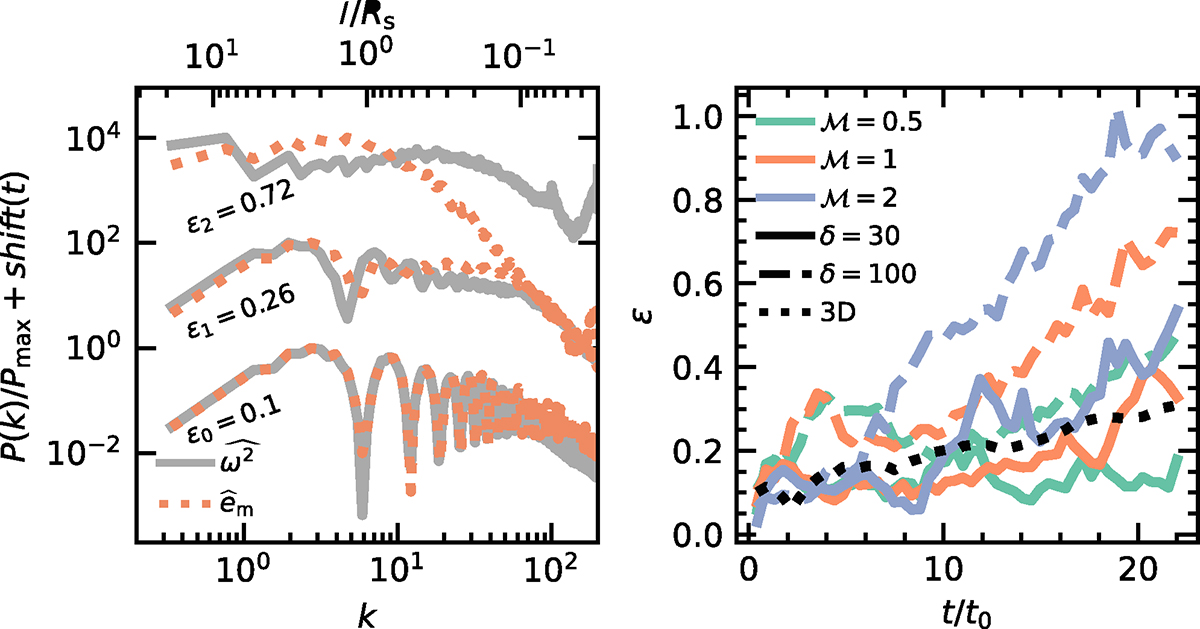
Difference between the enstrophy and magnetic energy spectrum. Left: Illustrative plot of the enstrophy and magnetic energy power spectra normalised by their maximum values at different time (t0, t1, t2)∼(0.02, 0.1, 1)tend. For clarity, the spectra are shifted on the y-axis, and their corresponding deviation ε is shown. The results shown here are for a 2D MHD+TC simulation with ℳ = 1, δ = 100, ns = 0.01 m−3. Right: Time profile of the difference ε for different Mach number ℳ, and density ratio δ = 100. The results shown here are for 2D MHD+TC simulations with ns = 0.01 m−3, and a 3D MHD simulation (black dotted line) with ℳ = 1, δ = 30, ns = 0.01 m−3.
Current usage metrics show cumulative count of Article Views (full-text article views including HTML views, PDF and ePub downloads, according to the available data) and Abstracts Views on Vision4Press platform.
Data correspond to usage on the plateform after 2015. The current usage metrics is available 48-96 hours after online publication and is updated daily on week days.
Initial download of the metrics may take a while.