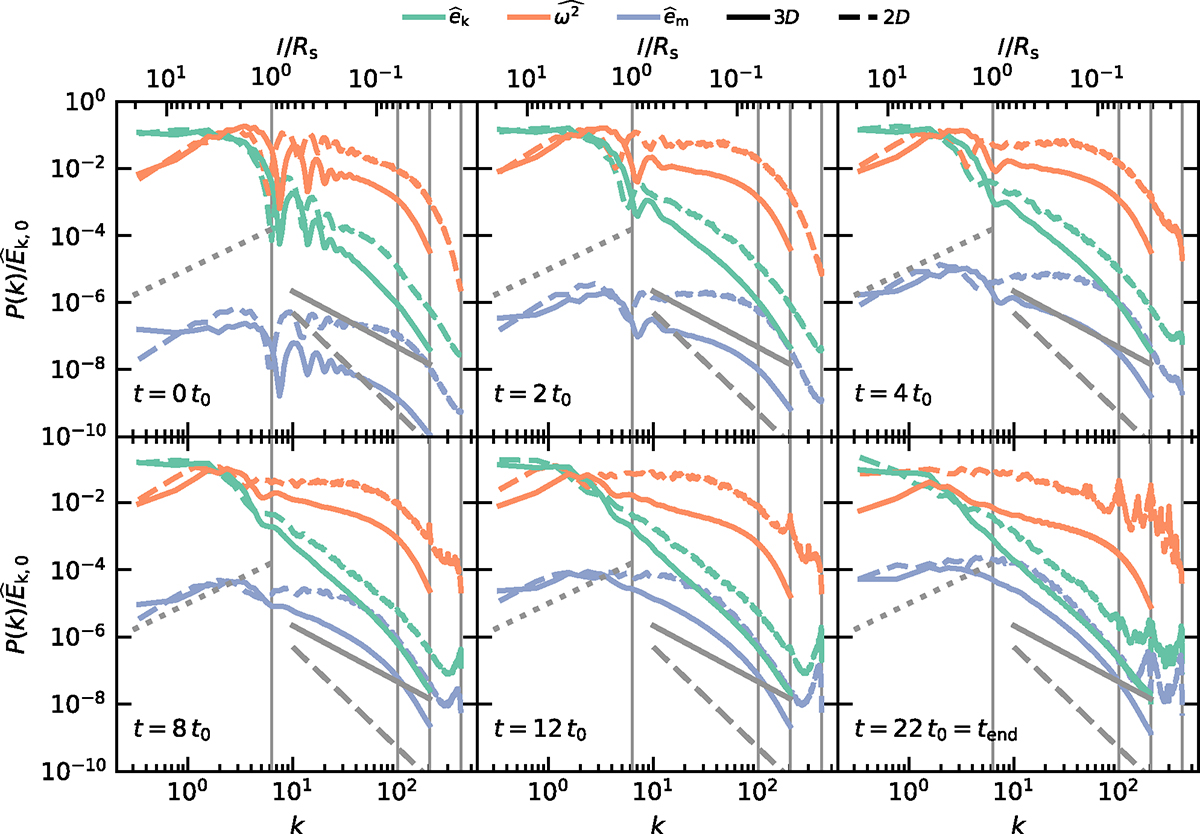
Fig. A.1.
Download original image
Power spectra of the kinetic energy, the enstrophy, and the magnetic energy normalised by the total initial kinetic energy. Results are shown for both 2D and 3D MHD simulations with ℳ = 1, δ = 30, ns = 0.01 cm−3. The spectra are plotted at different times in each panel. From left to right, the vertical black lines refer to length-scales of Rs, Rs/16, Rs/32, and Rs/64, the minimum cell size. For illustration, the power laws k3/2, k−5/3 and k−3 are shown by grey dotted, plain and dashed lines, respectively.
Current usage metrics show cumulative count of Article Views (full-text article views including HTML views, PDF and ePub downloads, according to the available data) and Abstracts Views on Vision4Press platform.
Data correspond to usage on the plateform after 2015. The current usage metrics is available 48-96 hours after online publication and is updated daily on week days.
Initial download of the metrics may take a while.