Fig. 6.
Download original image
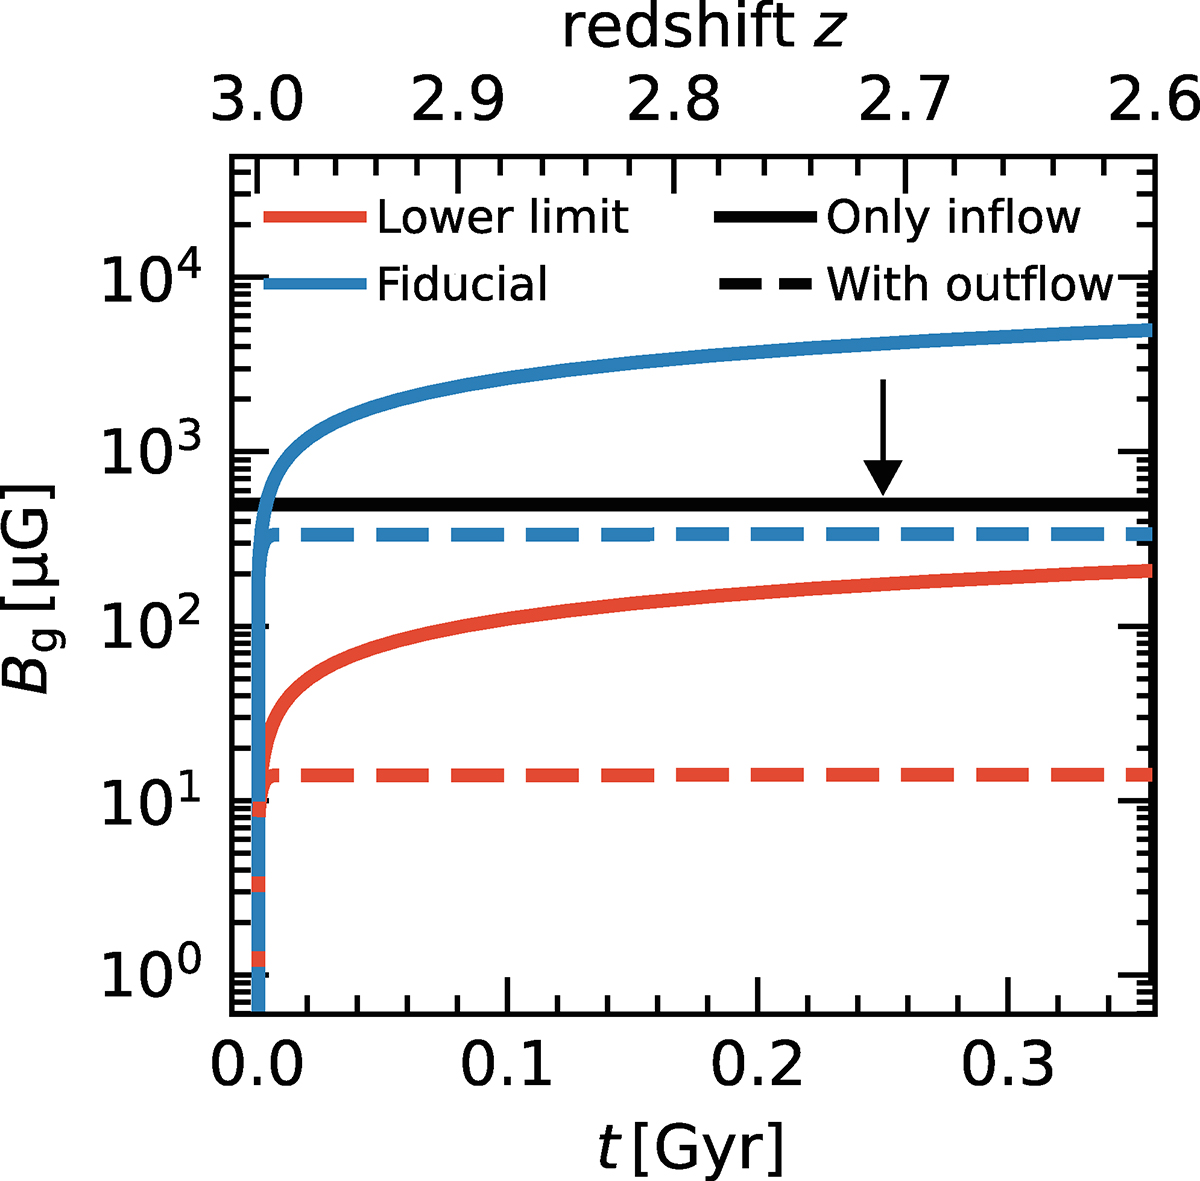
Time evolution of the mean galactic magnetic field of our model. The corresponding redshift is also given at the top axis assuming that the accretion starts at z = 3. The blue and red curves represent the fiducial and lower-limit scenarios. The solid and dotted lines are models without and with outflows. The black line with the arrow shows the target at 500 μG or less from Geach et al. (2023).
Current usage metrics show cumulative count of Article Views (full-text article views including HTML views, PDF and ePub downloads, according to the available data) and Abstracts Views on Vision4Press platform.
Data correspond to usage on the plateform after 2015. The current usage metrics is available 48-96 hours after online publication and is updated daily on week days.
Initial download of the metrics may take a while.