Fig. 4.
Download original image
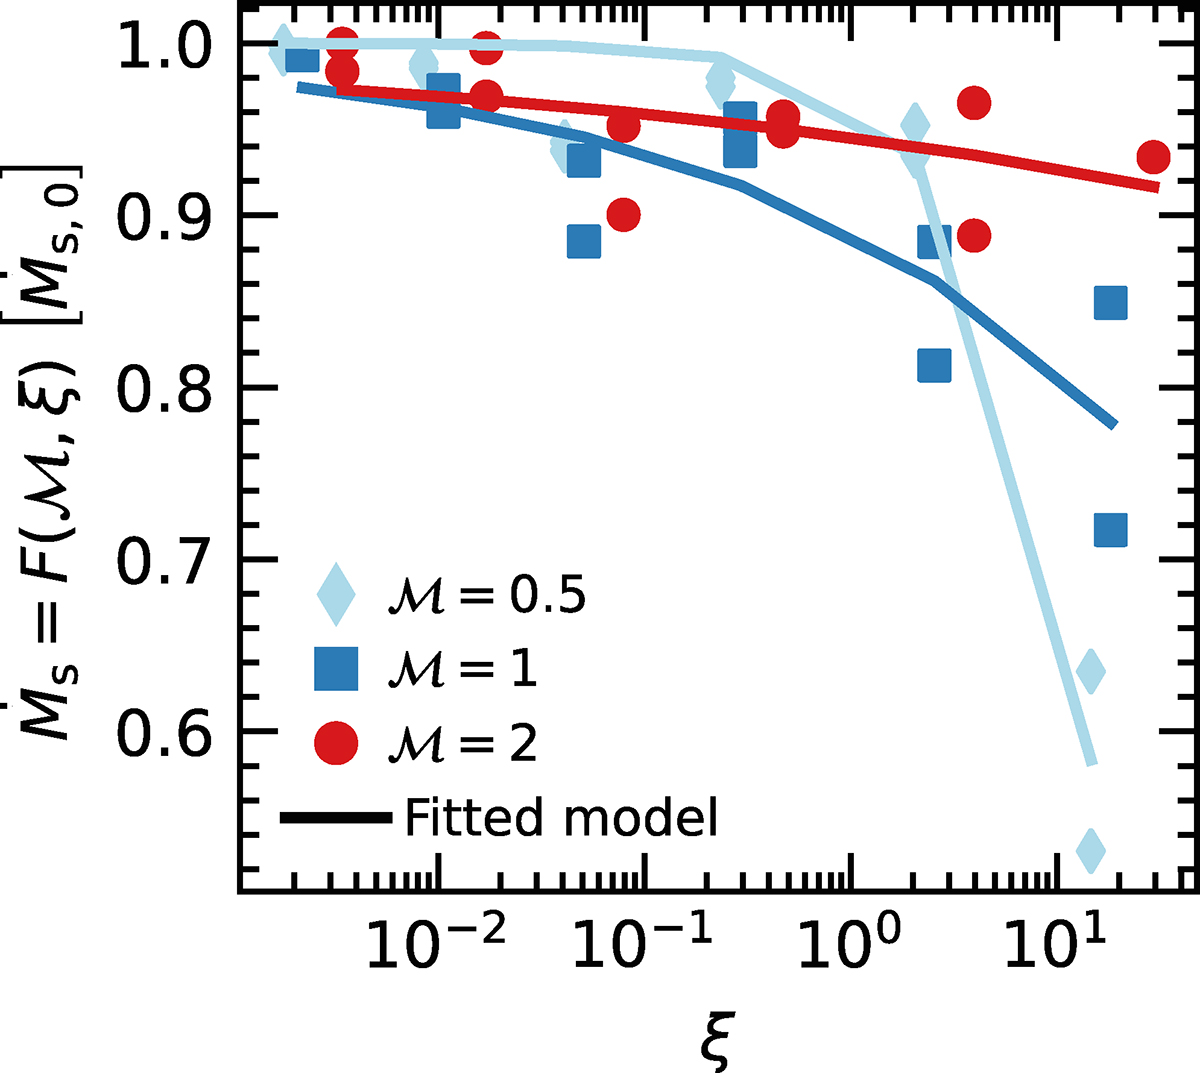
Cold mass flux rate normalised by the initial cold mass flux of the simulations. Each point represents one simulation with a fixed ξ, ℳ, and initial magnetic angle ϕ with respect to the stream axis. Red dots, blue squares, and cyan diamonds refer to 2D simulations with ℳ = 2, 1, 0.5, respectively. Using the same colour legend, the fitted model is represented by coloured curves. For a fixed ξ and ℳ, the two points represent simulations with an initial magnetic field angle of 90° and 45° with the highest values associated with the 90° angle in all cases.
Current usage metrics show cumulative count of Article Views (full-text article views including HTML views, PDF and ePub downloads, according to the available data) and Abstracts Views on Vision4Press platform.
Data correspond to usage on the plateform after 2015. The current usage metrics is available 48-96 hours after online publication and is updated daily on week days.
Initial download of the metrics may take a while.