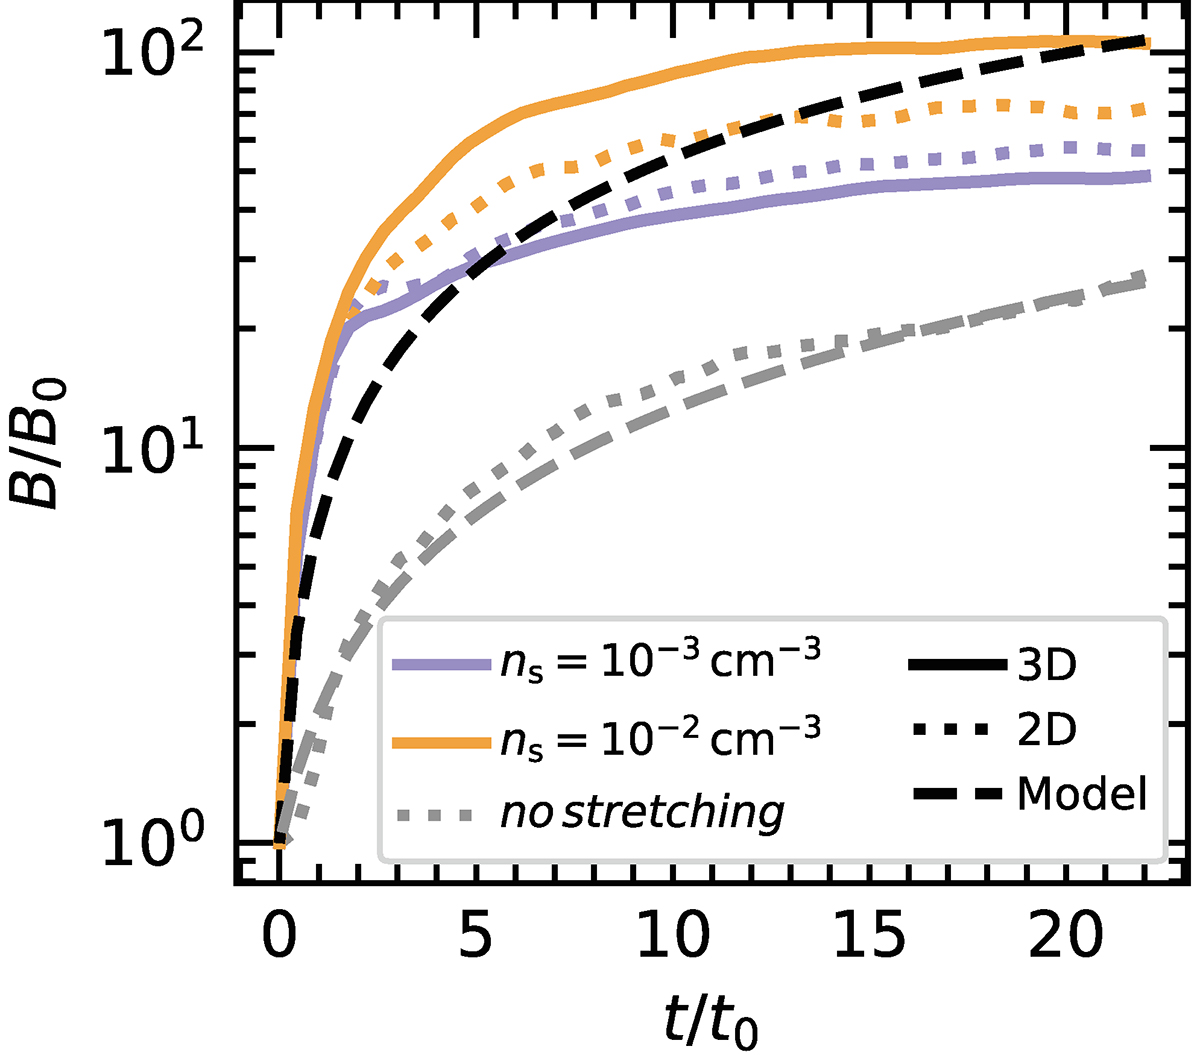
Fig. 2.
Download original image
Time profiles of the magnetic field in the stream for 2D and 3D simulations (dotted and solid lines, respectively). Simulations are shown for ns = 10−2 and 10−3 cm−3 in purple and orange, respectively. The dotted grey line stands for a 2D simulation with ns = 10−2 cm−3 and with a magnetic field parallel to the stream (no amplification due to stretching). The dashed lines show the model results from Eq. (2) with the same Mach number as the simulations (ℳ = 1).
Current usage metrics show cumulative count of Article Views (full-text article views including HTML views, PDF and ePub downloads, according to the available data) and Abstracts Views on Vision4Press platform.
Data correspond to usage on the plateform after 2015. The current usage metrics is available 48-96 hours after online publication and is updated daily on week days.
Initial download of the metrics may take a while.