Fig. 9
Download original image
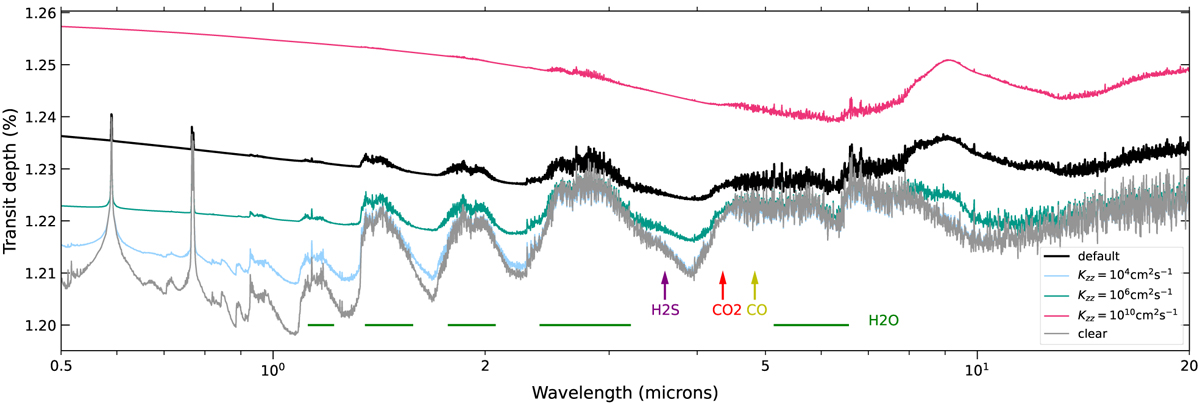
Transmission spectrum of a cloudy hot Jupiter (black line). The gray line shows the transmission spectrum of a clear atmosphere, leaving the gas components unchanged. Kzz is varied to show how cloud formation changes the atmospheric transmission spectrum. The horizontal lines and arrows indicate molecular features. At long wavelengths the Kzz = 104 cm2 s−1 run curves are indistinguishable from the “clear” curve.
Current usage metrics show cumulative count of Article Views (full-text article views including HTML views, PDF and ePub downloads, according to the available data) and Abstracts Views on Vision4Press platform.
Data correspond to usage on the plateform after 2015. The current usage metrics is available 48-96 hours after online publication and is updated daily on week days.
Initial download of the metrics may take a while.