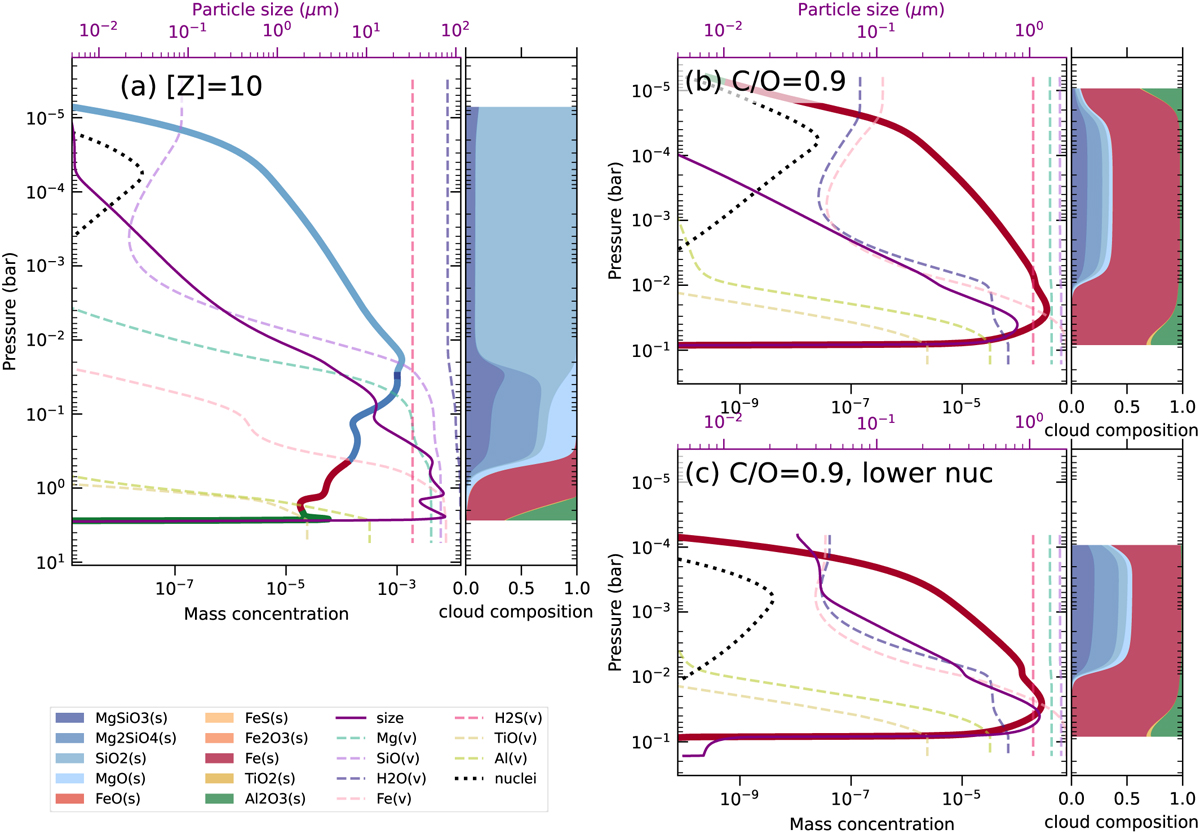
Fig. 8
Download original image
Effect of vapor abundances at the lower boundary of atmosphere on the solid, vapor, nuclei profile, particle size, and cloud composition. (a) 10×-Z hot Jupiter model; (b) C/O=0.9 hot Jupiter model; (c) C/O=0.9 hot Jupiter model, similar to (b), but with injection of larger nuclei deeper in the atmosphere, mimicking nucleation featuring high particle surface tension. The thick solid, dashed, and dotted lines indicate total cloud, vapor, and nuclei mixing ratios, respectively. The purple solid line shows the particle size. The right subpanel in each panel shows the composition of the cloud particles in mass. Compared to the default model (Figure 3) the upper cloud layers of the 10×-[Z] run become devoid in Mg (SiO2 dominates) while in the C/O=0.9 run Fe-bearing cloud particles make it into the upper regions.
Current usage metrics show cumulative count of Article Views (full-text article views including HTML views, PDF and ePub downloads, according to the available data) and Abstracts Views on Vision4Press platform.
Data correspond to usage on the plateform after 2015. The current usage metrics is available 48-96 hours after online publication and is updated daily on week days.
Initial download of the metrics may take a while.