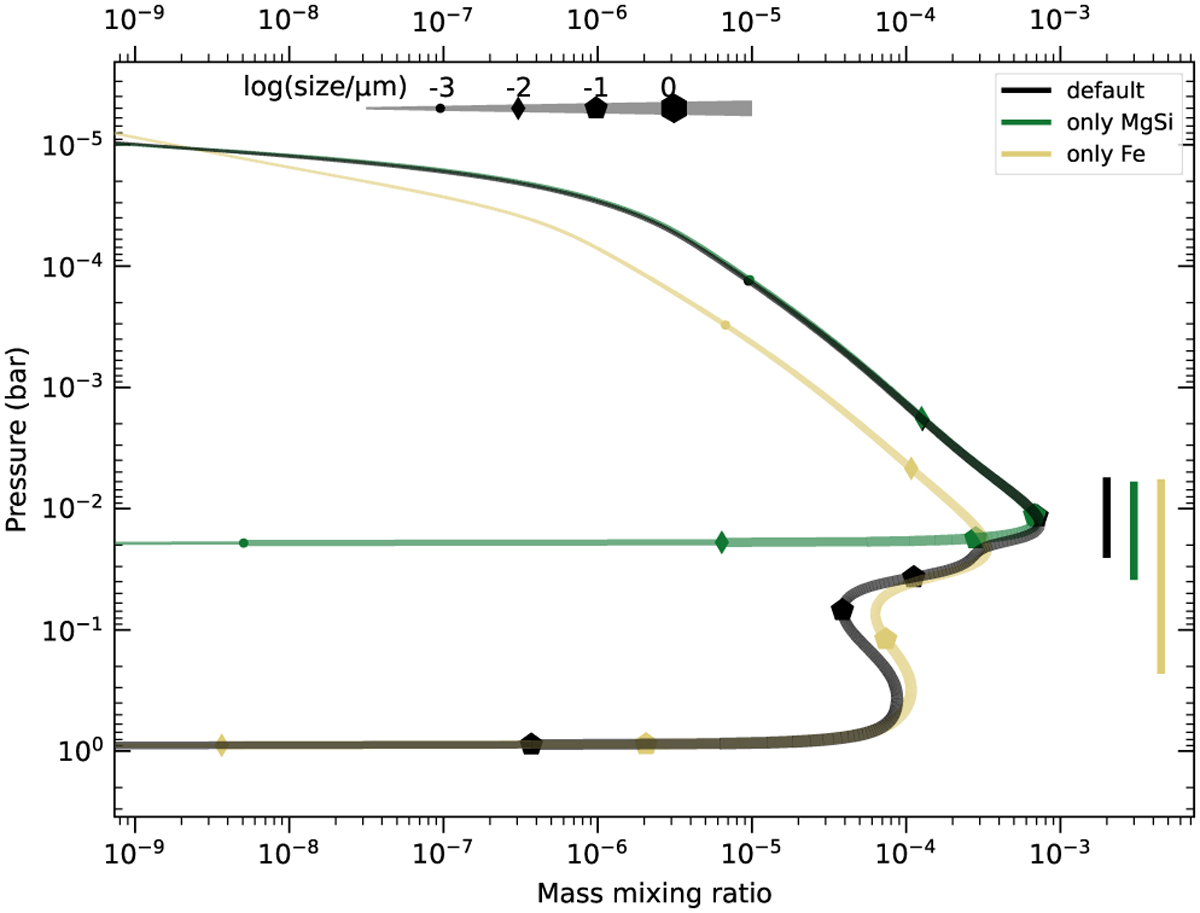
Fig. 7
Download original image
Cloud profiles with different condensation reactions. The full set of reactions Table 3 is shown as the black line. The green and yellow line only includes the magnesiumsilicate group versus the iron and refractory reaction group, that is, the first four rows and the last six rows in Table 3. The vertical lines represent where the near-IR optical depth accumulates to unity.
Current usage metrics show cumulative count of Article Views (full-text article views including HTML views, PDF and ePub downloads, according to the available data) and Abstracts Views on Vision4Press platform.
Data correspond to usage on the plateform after 2015. The current usage metrics is available 48-96 hours after online publication and is updated daily on week days.
Initial download of the metrics may take a while.