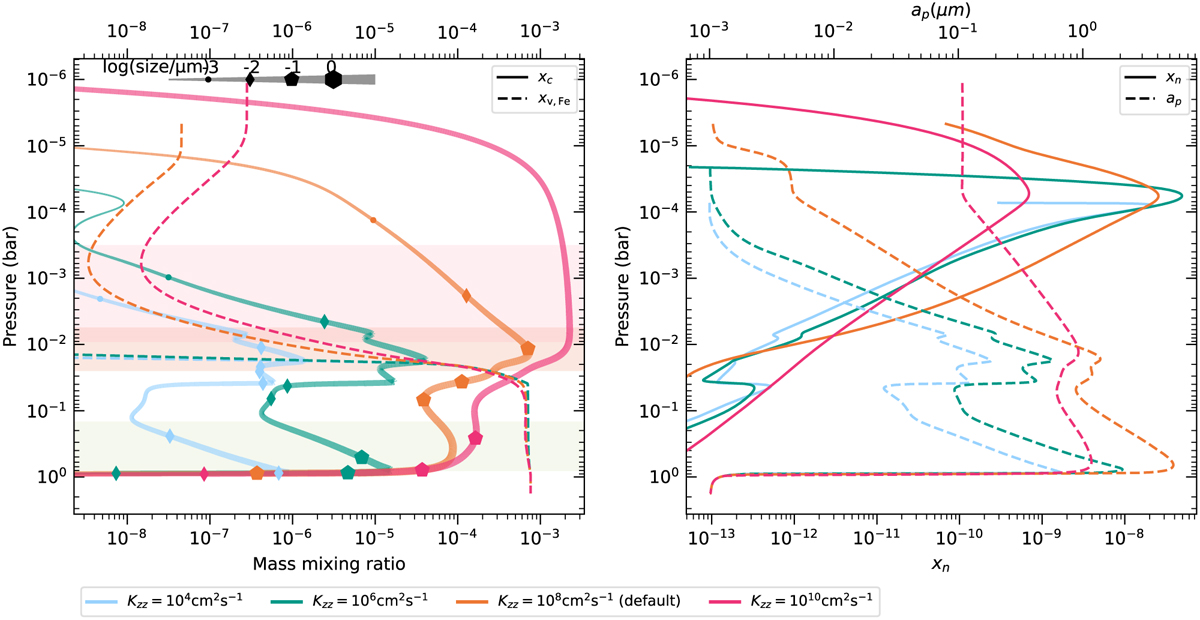
Fig. 5
Download original image
Cloud profiles under different eddy diffusivity parameters Kzz, which serve as effective vertical turbulence. Left: total cloud mixing ratio (solid lines) and Fe vapor mixing ratio (dashed lines) as an example. Right: nuclei mixing ratio (solid lines) and particle size (dashed lines). Similar to Figure 3, the location where the cloud optical depth reaches unity is shown in the left panel by the horizontal bands with corresponding colors. We note that there is no blue band corresponding to Kzz = 104 cm2s−1, because the cloud optical depth never reaches 1.
Current usage metrics show cumulative count of Article Views (full-text article views including HTML views, PDF and ePub downloads, according to the available data) and Abstracts Views on Vision4Press platform.
Data correspond to usage on the plateform after 2015. The current usage metrics is available 48-96 hours after online publication and is updated daily on week days.
Initial download of the metrics may take a while.