Fig. 4
Download original image
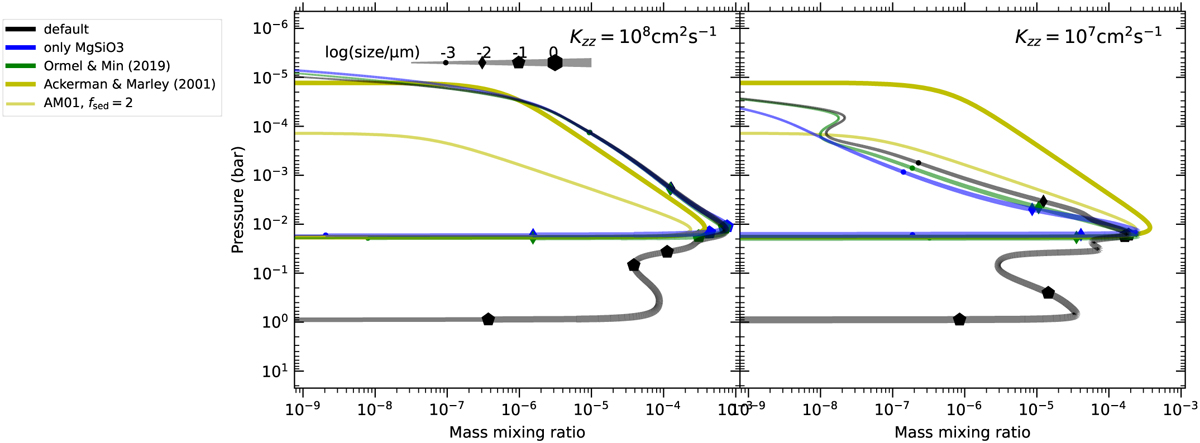
Comparison of the full ExoLyn model (default), ExoLyn restricted with MgSiO3 condensates only, the Ormel & Min (2019) model, and Ackerman & Marley (2001). The thickness of the lines and the symbols on the lines indicates the particle size, except in the Ackerman & Marley (2001) runs, where the particle size is not solved for as it decouples with the cloud concentration in the model. Right: the same as left, but Kzz decreased to 107 cm2s−1. In this case, the fsed = 2 run (thin line) provides a better correspondence to other models.
Current usage metrics show cumulative count of Article Views (full-text article views including HTML views, PDF and ePub downloads, according to the available data) and Abstracts Views on Vision4Press platform.
Data correspond to usage on the plateform after 2015. The current usage metrics is available 48-96 hours after online publication and is updated daily on week days.
Initial download of the metrics may take a while.