Fig. 3
Download original image
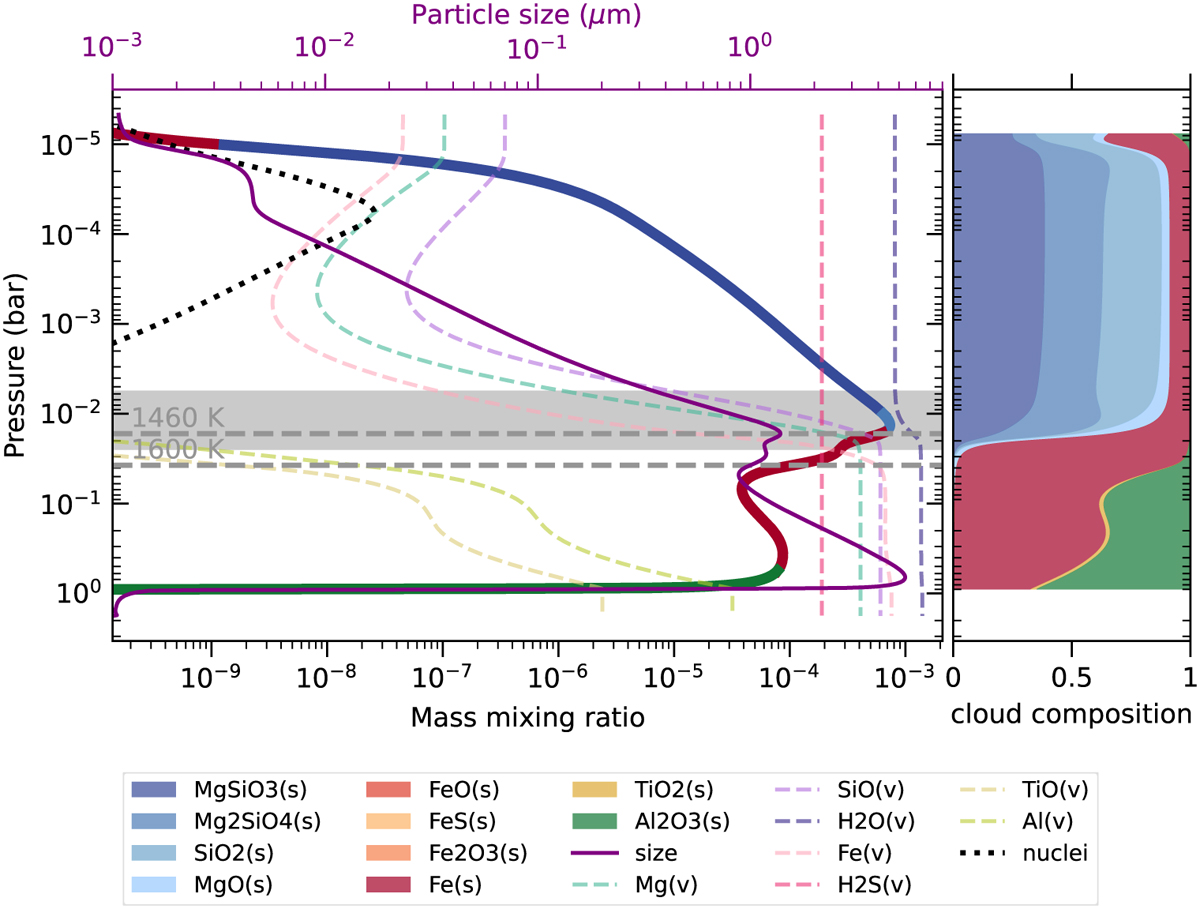
Atmosphere structure of the default hot Jupiter model. The thick colored line shows the cloud mass mixing ratio summed over all species. The dominant species by mass is illustrated by the color of the thick line. Vapor mixing ratios are shown by dashed lines. The dotted black line denotes the nuclei mass mixing ratio and the purple thin line denotes the cloud particle size, which should be referred to the upper axis. In the figure we also label the evaporation temperature of magnesiumsilicates (1460 K) and iron (1600 K) with horizontal dashed lines. The gray band refers to where the cloud optical depth in the IR band (1 μm − 20 μm), integrated from the top of the atmosphere, reaches 1. The right panel shows the composition of cloud particles in mass.
Current usage metrics show cumulative count of Article Views (full-text article views including HTML views, PDF and ePub downloads, according to the available data) and Abstracts Views on Vision4Press platform.
Data correspond to usage on the plateform after 2015. The current usage metrics is available 48-96 hours after online publication and is updated daily on week days.
Initial download of the metrics may take a while.