Open Access
Fig. 9.
Download original image
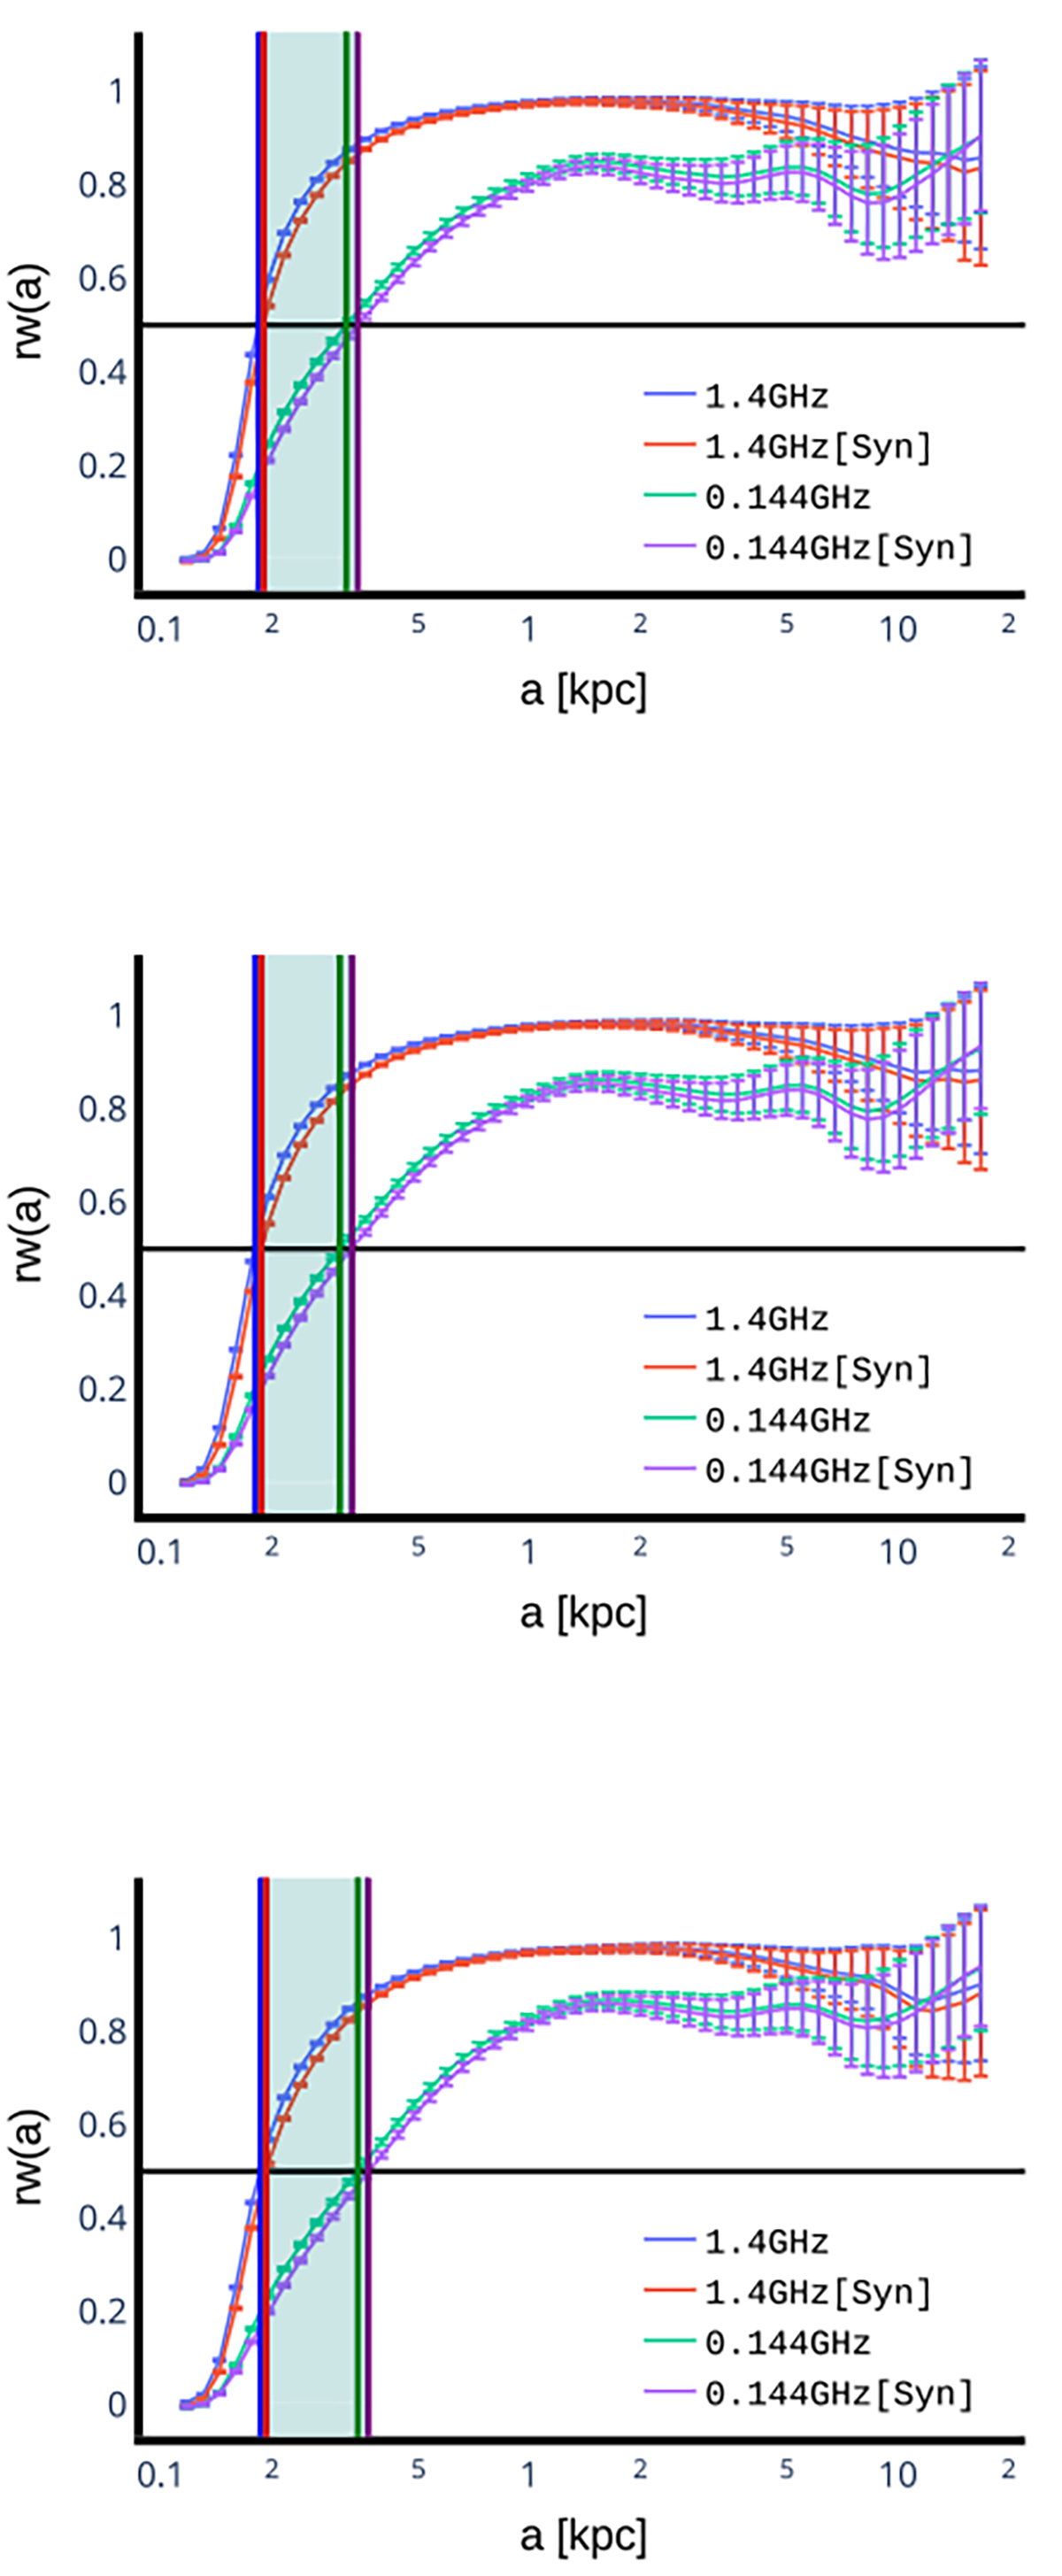
Multi-scale correlation between the radio continuum emission and the FIR bands at 70 μm (top), 100 μm (middle), and 160 μm (bottom). In each panel, the solid horizontal line shows rw = 0.5, and vertical lines indicate its corresponding scales of occurrence (lbreak) for different radio and FIR pairs.
Current usage metrics show cumulative count of Article Views (full-text article views including HTML views, PDF and ePub downloads, according to the available data) and Abstracts Views on Vision4Press platform.
Data correspond to usage on the plateform after 2015. The current usage metrics is available 48-96 hours after online publication and is updated daily on week days.
Initial download of the metrics may take a while.