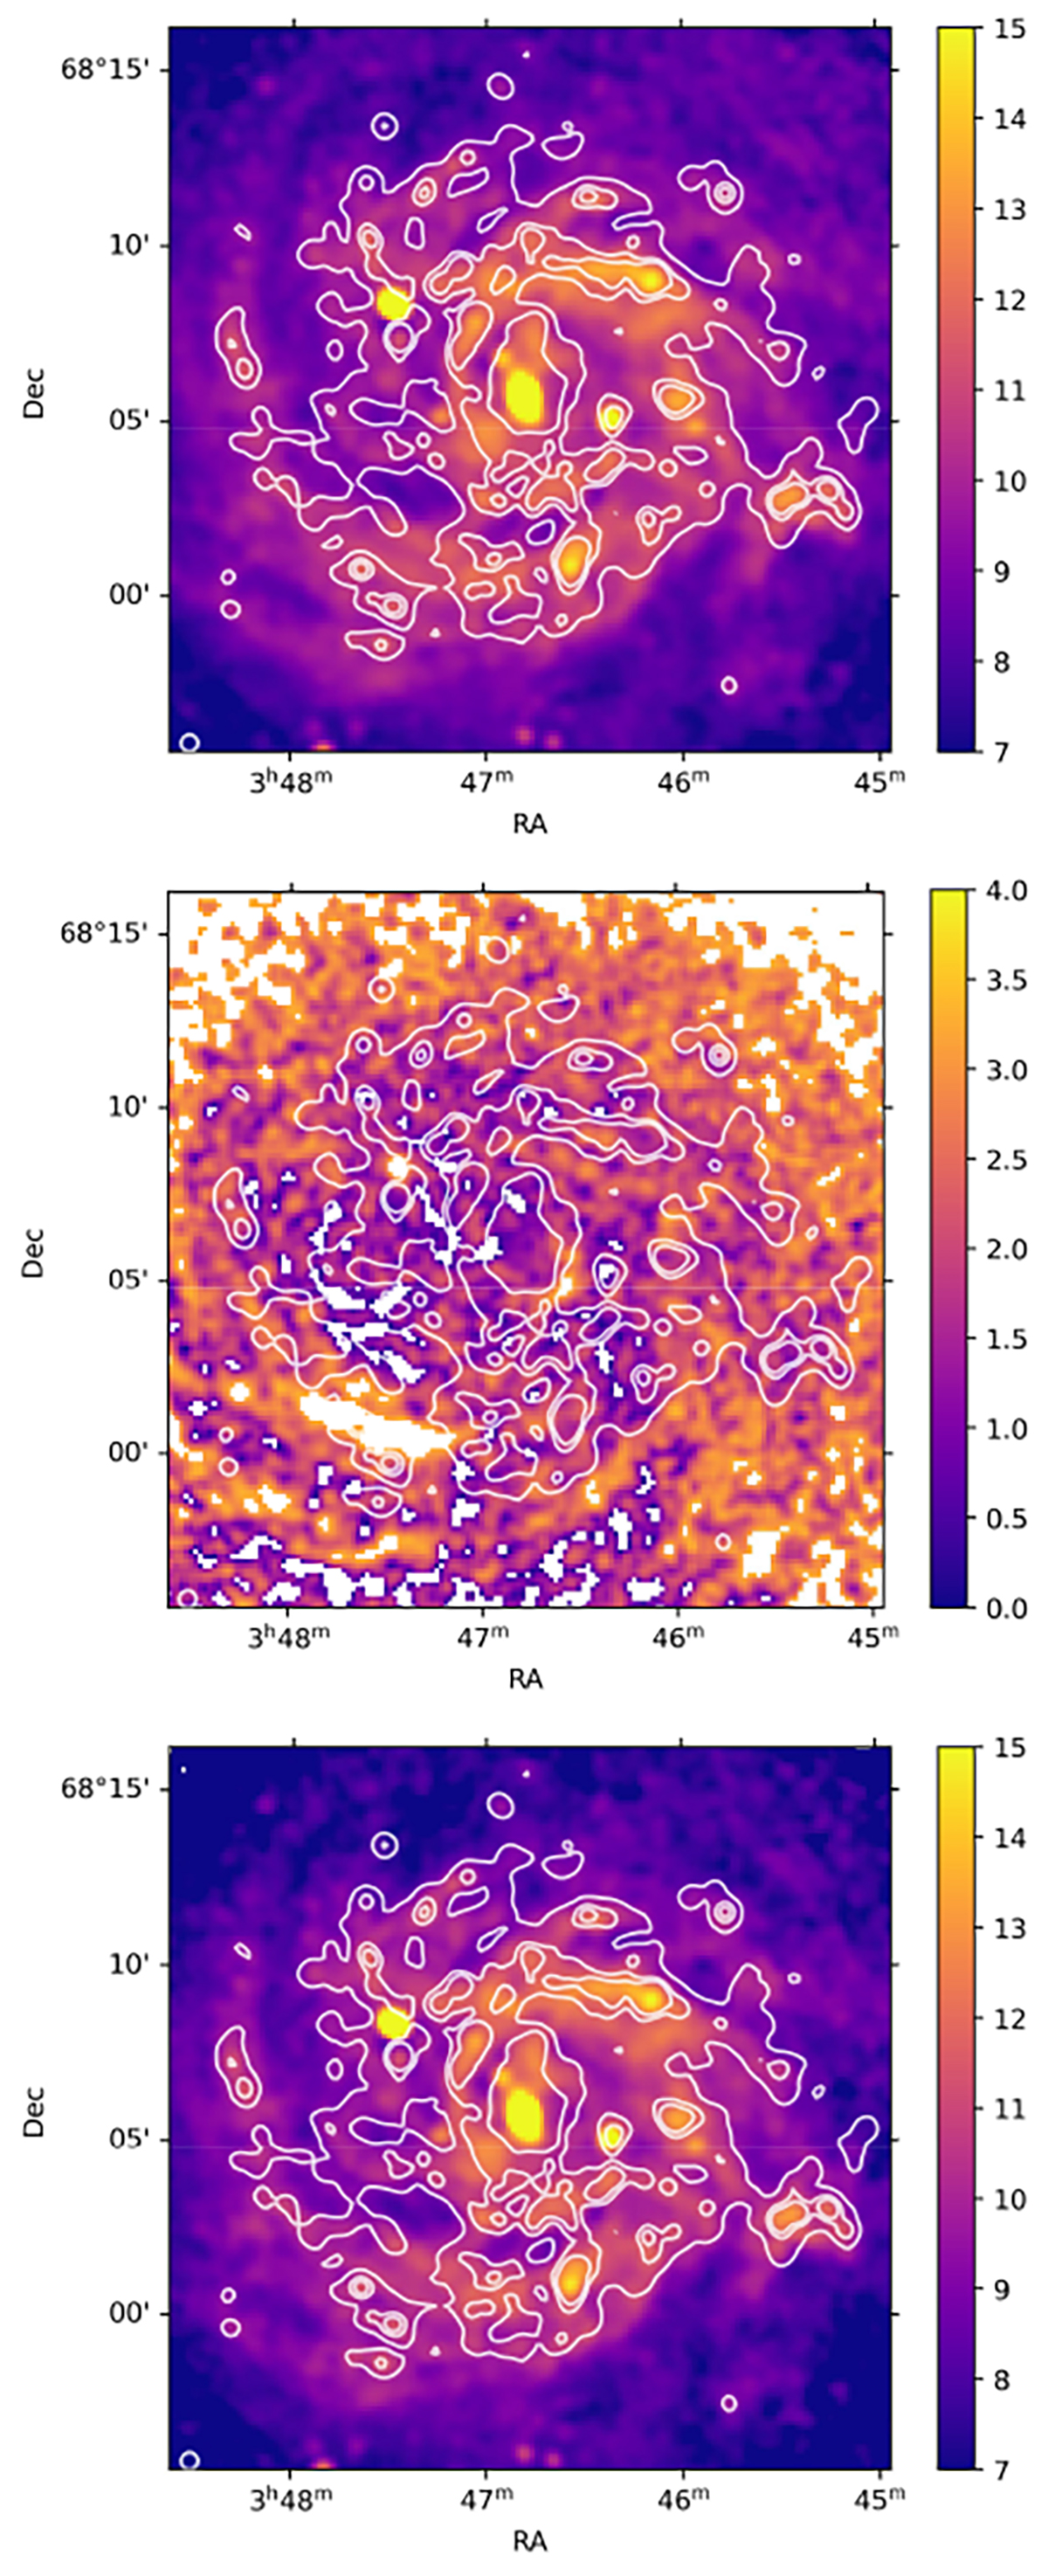
Fig. 6.
Download original image
Magnetic field strength maps in IC 342. Strength of the total magnetic field Btot obtained using the synchrotron emission at 1.4 GHz in IC 342 at a 25″ angular resolution (top). Also shown are maps of the ordered Bord (middle) and turbulent Btur (bottom) magnetic field strengths. The bars on the right of each image show the magnetic field strength in μG. Contours show the 22 μm emission at levels of 2, 4, 6, 8, and 10 × 10−4 Jy/pix.
Current usage metrics show cumulative count of Article Views (full-text article views including HTML views, PDF and ePub downloads, according to the available data) and Abstracts Views on Vision4Press platform.
Data correspond to usage on the plateform after 2015. The current usage metrics is available 48-96 hours after online publication and is updated daily on week days.
Initial download of the metrics may take a while.