Fig. B.3
Download original image
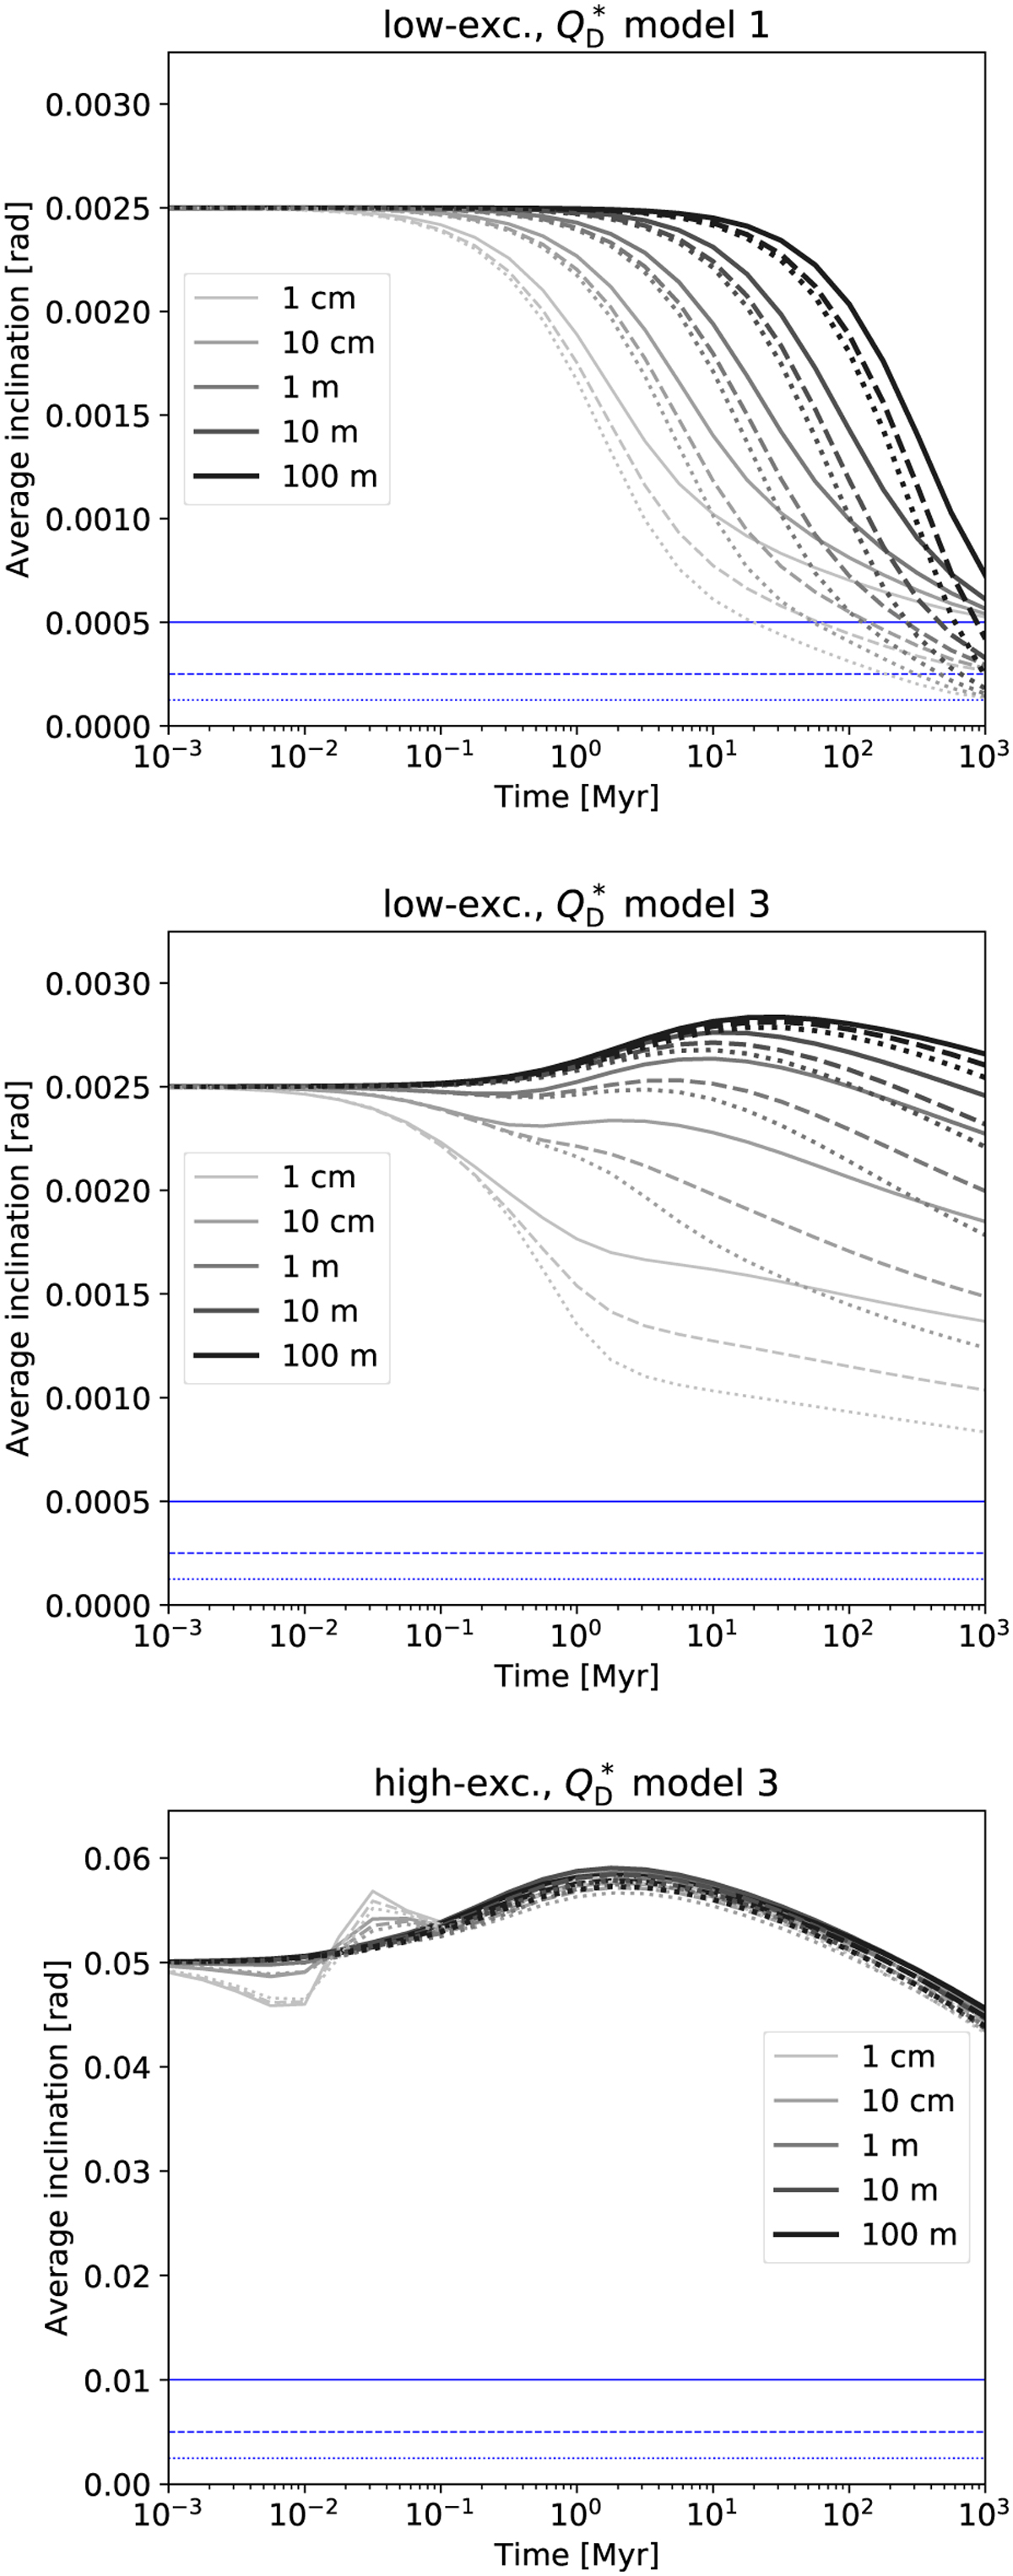
Resolution tests show average inclination as function of time, for different particle sizes (see plot legend), for three of our models (top panel: low-excitation disc using ![]() model 1; middle panel: low-excitation disc using
model 1; middle panel: low-excitation disc using ![]() model 3; bottom panel: high-excitation disc using
model 3; bottom panel: high-excitation disc using ![]() model 3) for three different grid resolutions (solid lines: ne = ni = 5; dashed lines: ne = ni = 10; dotted lines: ne = ni = 20). Horizontal blue lines show the lowest grid bin values, i.e. the lowest values to which the average inclination can be damped in each model.
model 3) for three different grid resolutions (solid lines: ne = ni = 5; dashed lines: ne = ni = 10; dotted lines: ne = ni = 20). Horizontal blue lines show the lowest grid bin values, i.e. the lowest values to which the average inclination can be damped in each model.
Current usage metrics show cumulative count of Article Views (full-text article views including HTML views, PDF and ePub downloads, according to the available data) and Abstracts Views on Vision4Press platform.
Data correspond to usage on the plateform after 2015. The current usage metrics is available 48-96 hours after online publication and is updated daily on week days.
Initial download of the metrics may take a while.