Fig. B.1
Download original image
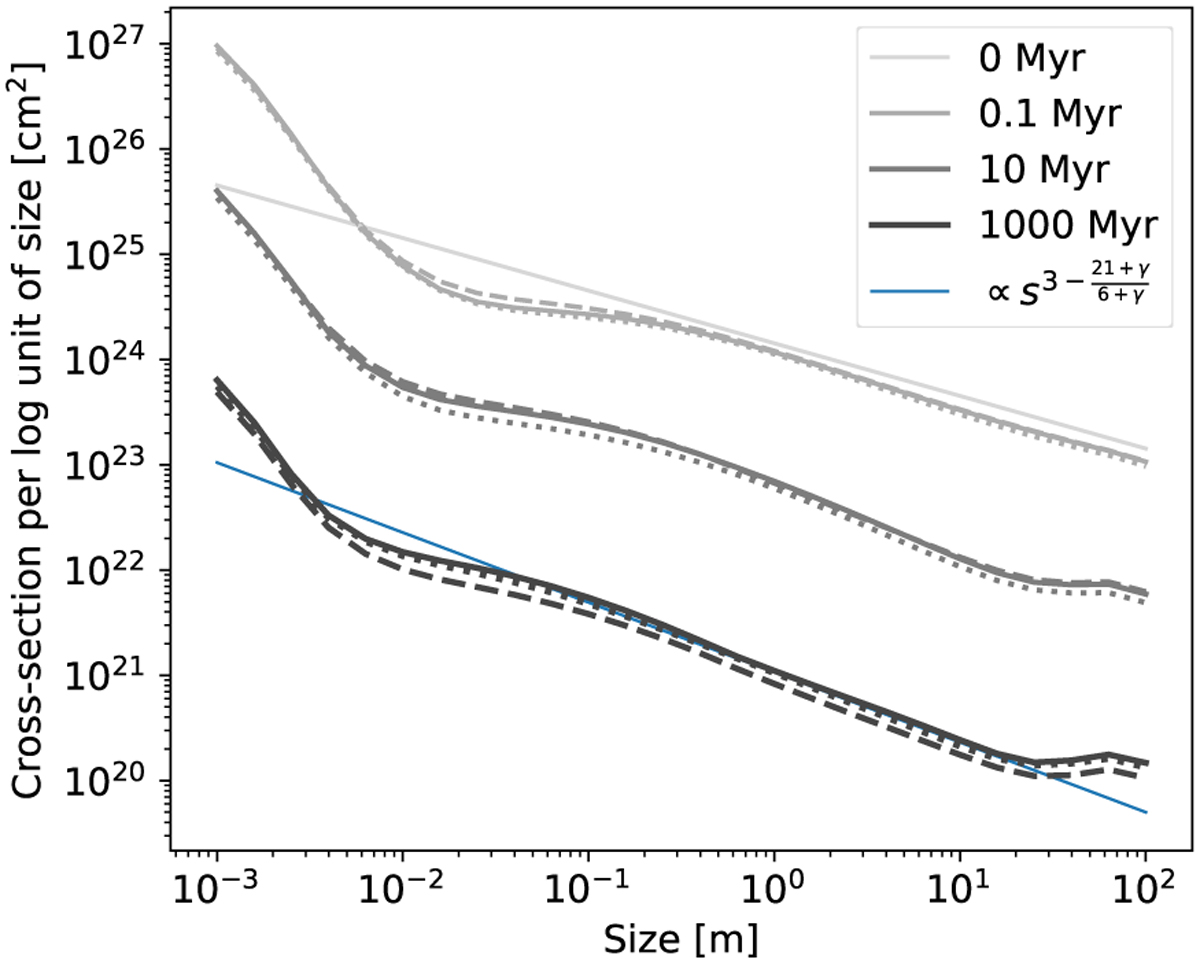
Cross-section area per base-10 logarithmic unit of size for ‘2D’ models, for our high-excitation disc parameters, obtained using Monte Carlo collision rates (solid lines) and using analytically calculated collision rates (dashed lines), and also for a corresponding ‘3D’ model (dotted lines). Results from the three models are shown as function of time (various shades of grey, see plot legend). Also shown is an analytically derived, arbitrarily scaled power-law describing a disc at steady-state, with bodies’ critical specific disruption energy in the strength regime (γ = −0.37; thin blue line).
Current usage metrics show cumulative count of Article Views (full-text article views including HTML views, PDF and ePub downloads, according to the available data) and Abstracts Views on Vision4Press platform.
Data correspond to usage on the plateform after 2015. The current usage metrics is available 48-96 hours after online publication and is updated daily on week days.
Initial download of the metrics may take a while.