Fig. 1
Download original image
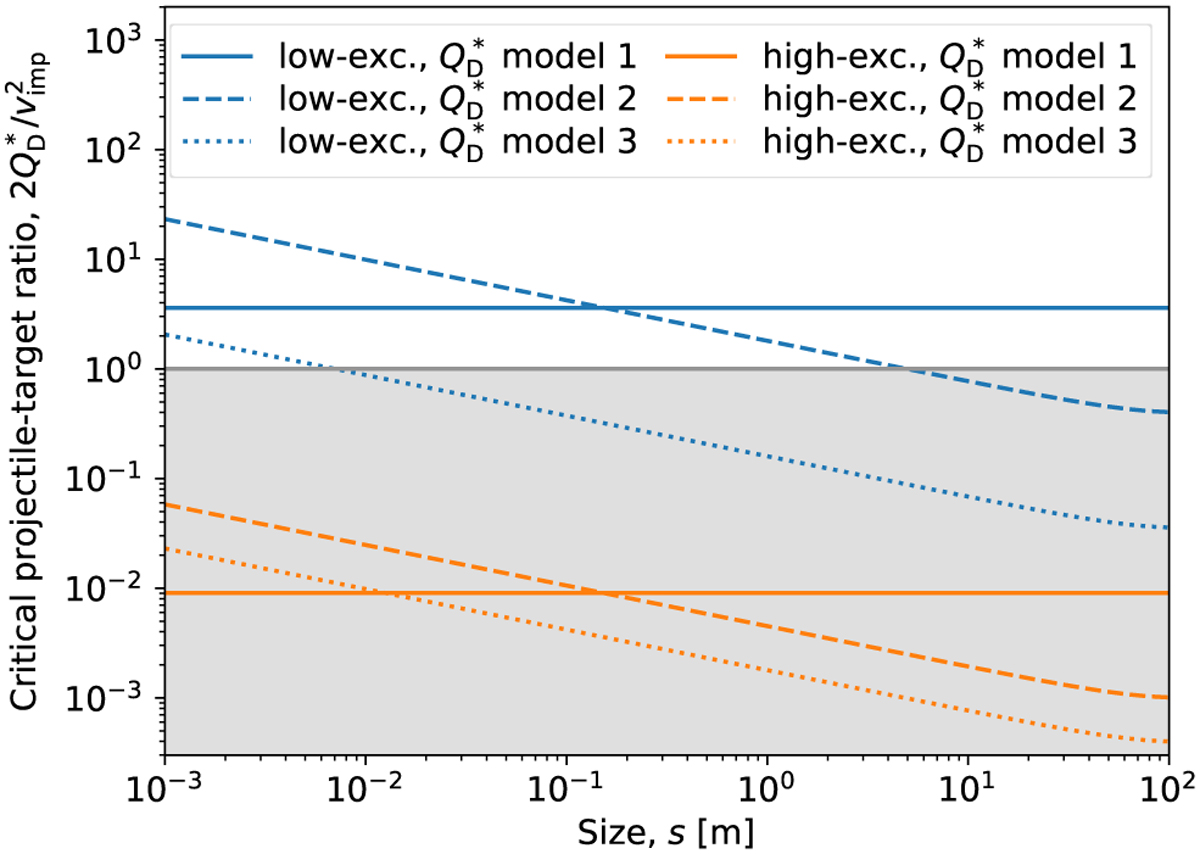
Approximate initial critical projectile-to-target mass ratio (Yc) for the models considered in Sects. 4.2 and 4.3. Blue and orange lines are for low-excitation (emax = 0.01) and high-excitation discs (emax = 0.2). respectively, and the different line styles are for different ![]() models shown in Table 1; see plot legend. Here for the average impact velocity we adopt υimp = υKemax/2, evaluated at the centre of the belt, at 40 au. The nearly power-law size-dependence is due to only considering sizes up to 100 m, which are all in the strength regime of material strength. Where the mass ratio shown is higher than unity, the exact value of it is unphysical, as the assumptions behind the simple formula break down, as discussed in Sect. 2. Nevertheless, this figure shows for which parameters we expect the disc evolution to be dominated by fragmentation, as opposed to bouncing or cratering.
models shown in Table 1; see plot legend. Here for the average impact velocity we adopt υimp = υKemax/2, evaluated at the centre of the belt, at 40 au. The nearly power-law size-dependence is due to only considering sizes up to 100 m, which are all in the strength regime of material strength. Where the mass ratio shown is higher than unity, the exact value of it is unphysical, as the assumptions behind the simple formula break down, as discussed in Sect. 2. Nevertheless, this figure shows for which parameters we expect the disc evolution to be dominated by fragmentation, as opposed to bouncing or cratering.
Current usage metrics show cumulative count of Article Views (full-text article views including HTML views, PDF and ePub downloads, according to the available data) and Abstracts Views on Vision4Press platform.
Data correspond to usage on the plateform after 2015. The current usage metrics is available 48-96 hours after online publication and is updated daily on week days.
Initial download of the metrics may take a while.