Open Access
Fig. 1.
Download original image
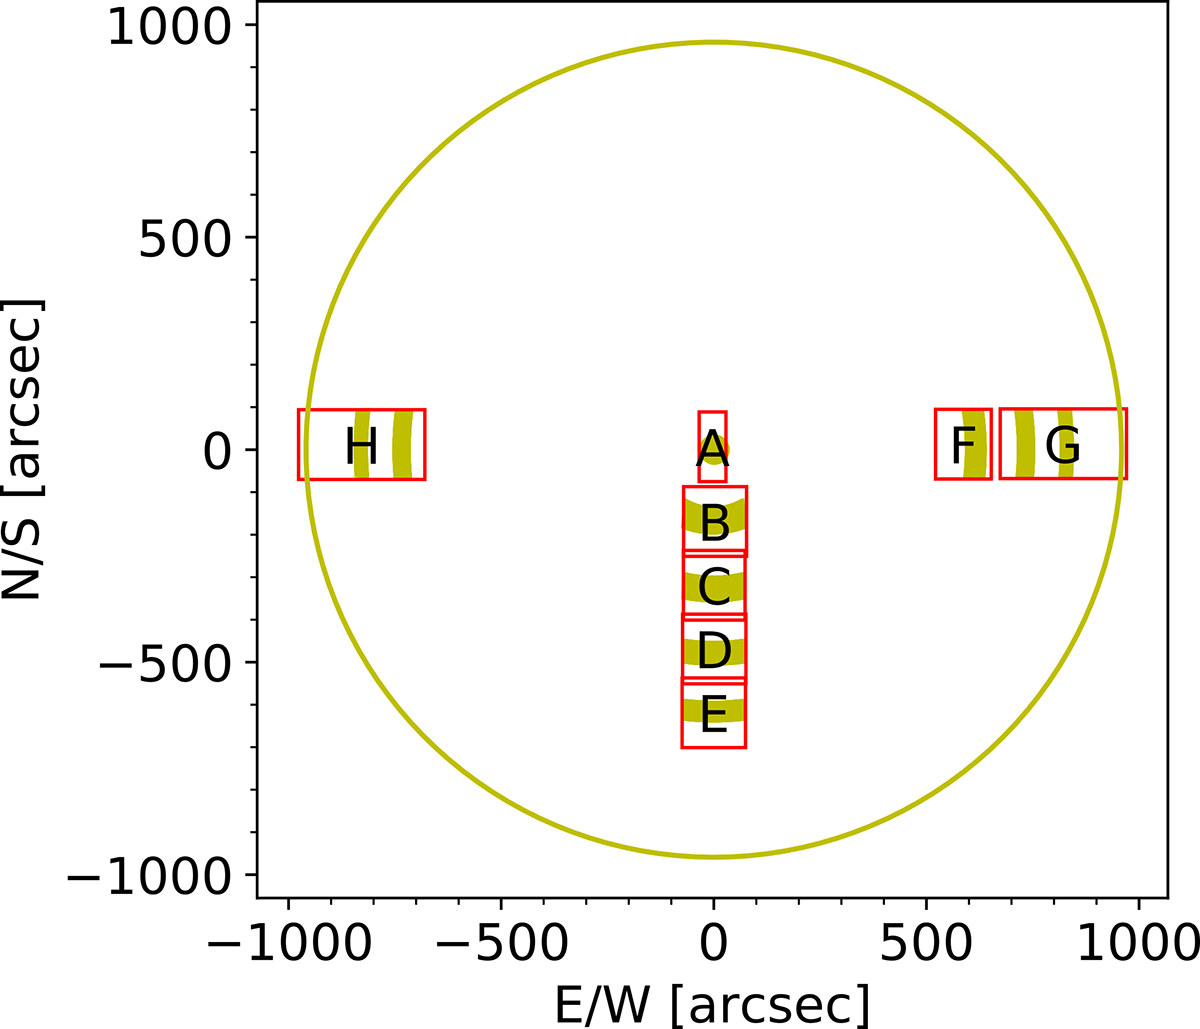
Position of each map on the solar disk in Table 1 as observed by the Hinode satellite. Shaded areas indicate the regions where ΔΘ = ±2° around the selected Θ values of [0° ,10° ,20° ,30° ,40° ,50° ,60° ] (see text for details).
Current usage metrics show cumulative count of Article Views (full-text article views including HTML views, PDF and ePub downloads, according to the available data) and Abstracts Views on Vision4Press platform.
Data correspond to usage on the plateform after 2015. The current usage metrics is available 48-96 hours after online publication and is updated daily on week days.
Initial download of the metrics may take a while.