Fig. 9
Download original image
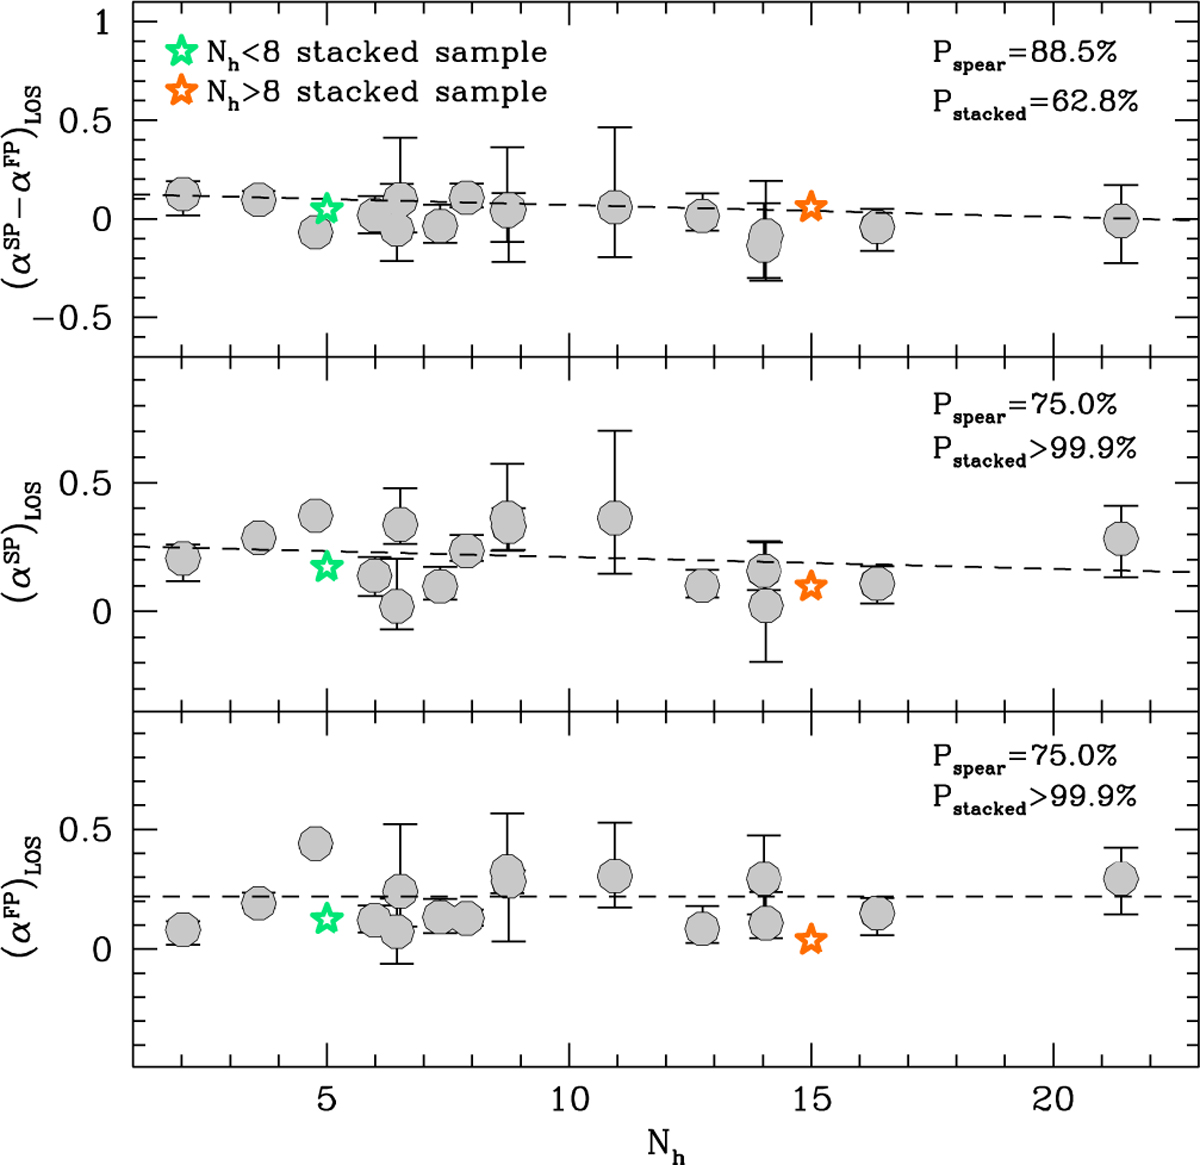
Bottom and middle panels show the distribution of the (α)LOS parameter for the FP and SP as a function of the dynamical age Nh for all clusters in the sample (gray circles). The upper panel shows the distribution of the rotation differences (αSP − αSP)LOS. The dashed lines represent the linear best-fit to the GC distribution. In all panels, the star symbols refer to the results obtained for the stacked analysis on the dynamically young (green) and old (orange) samples. The size of the star matches the amplitude of the errorbars.
Current usage metrics show cumulative count of Article Views (full-text article views including HTML views, PDF and ePub downloads, according to the available data) and Abstracts Views on Vision4Press platform.
Data correspond to usage on the plateform after 2015. The current usage metrics is available 48-96 hours after online publication and is updated daily on week days.
Initial download of the metrics may take a while.