Open Access
Fig. 7
Download original image
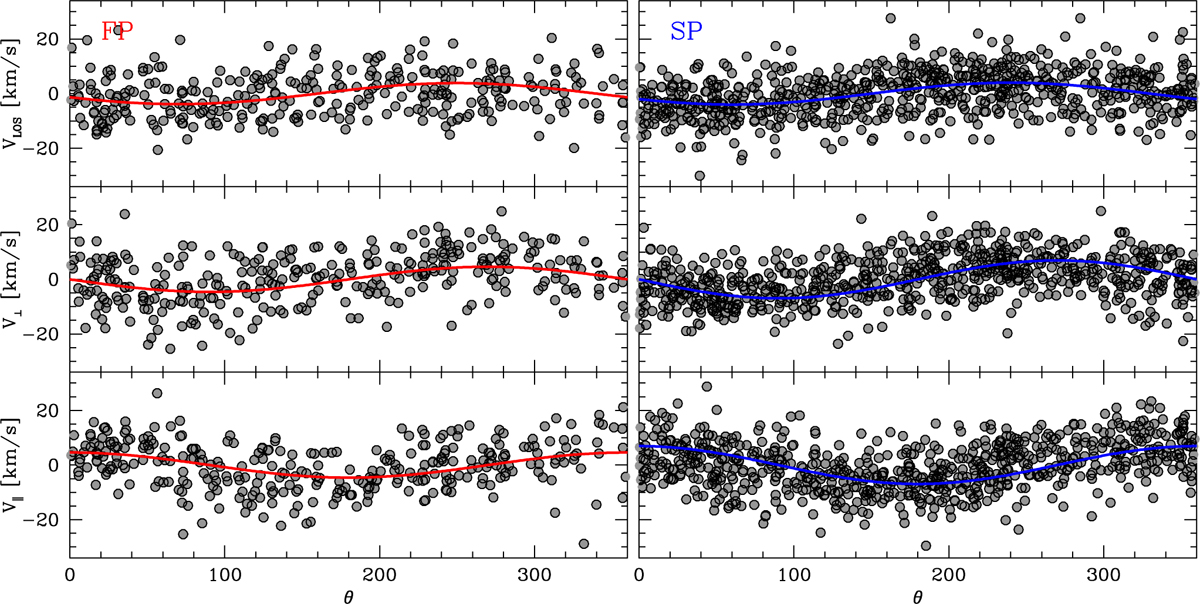
Distribution of the three velocity components as a function of the position angle for MPs in 47 Tuc. Left and right panels refer to the FP and SP subpopulations, respectively. The solid lines show the best-fitting trend in all panels.
Current usage metrics show cumulative count of Article Views (full-text article views including HTML views, PDF and ePub downloads, according to the available data) and Abstracts Views on Vision4Press platform.
Data correspond to usage on the plateform after 2015. The current usage metrics is available 48-96 hours after online publication and is updated daily on week days.
Initial download of the metrics may take a while.