Fig. 3
Download original image
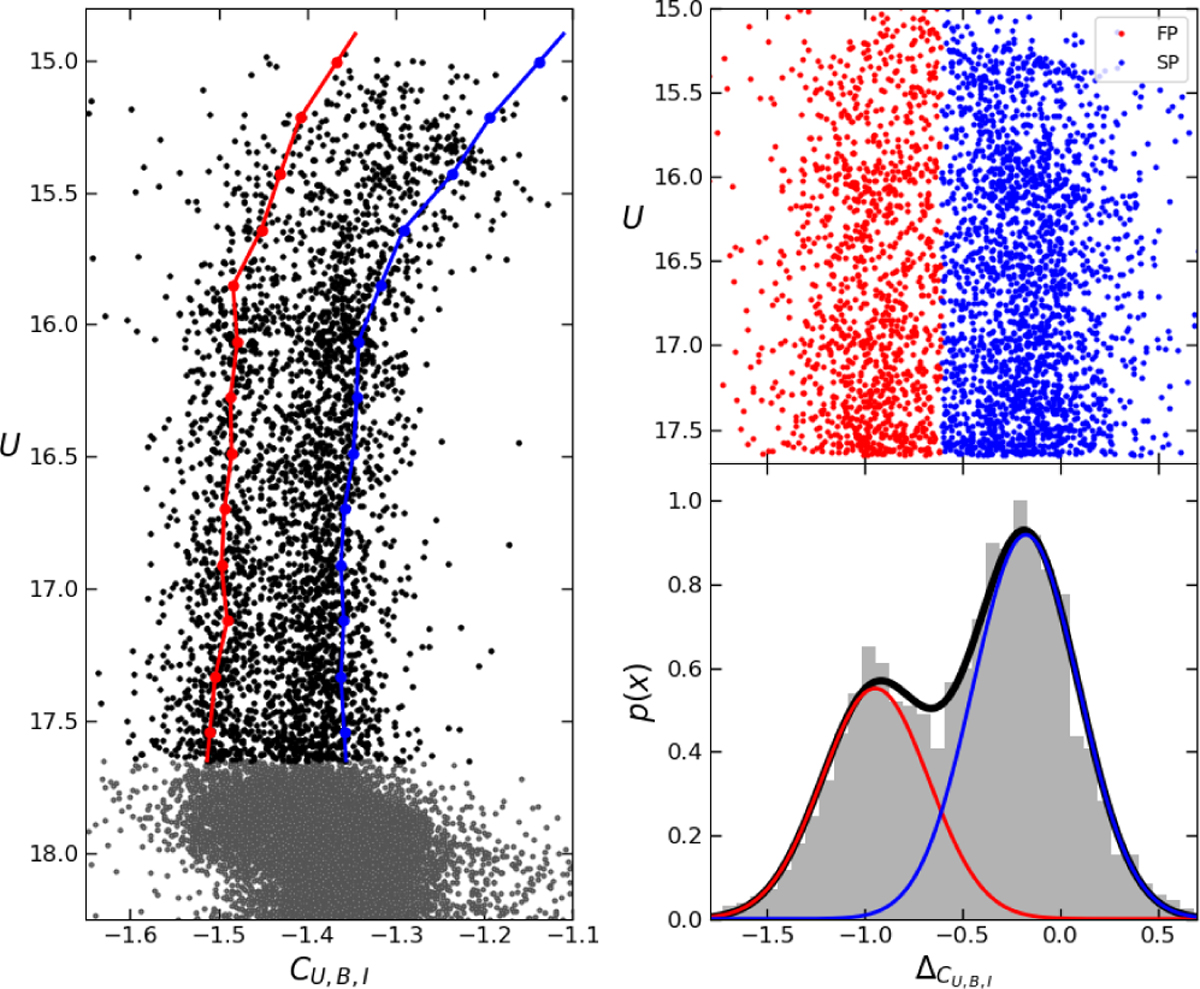
MP identification and selection for the case of 47 Tuc. Left panel: (U, CU,B,I) CMD of likely 47 Tuc member stars. RGB stars adopted for the kinematic analysis are highlighted in black. The blue and red curves are the fiducial lines adopted to verticalize the color distribution. Right panels: top panel displays verticalized color distribution of RGB stars, while the bottom panel shows the corresponding histograms. The red and blue curves represent the two best-fit Gaussians for the FP and SP, respectively, while the solid black curve is their sum.
Current usage metrics show cumulative count of Article Views (full-text article views including HTML views, PDF and ePub downloads, according to the available data) and Abstracts Views on Vision4Press platform.
Data correspond to usage on the plateform after 2015. The current usage metrics is available 48-96 hours after online publication and is updated daily on week days.
Initial download of the metrics may take a while.