Open Access
Fig. 16
Download original image
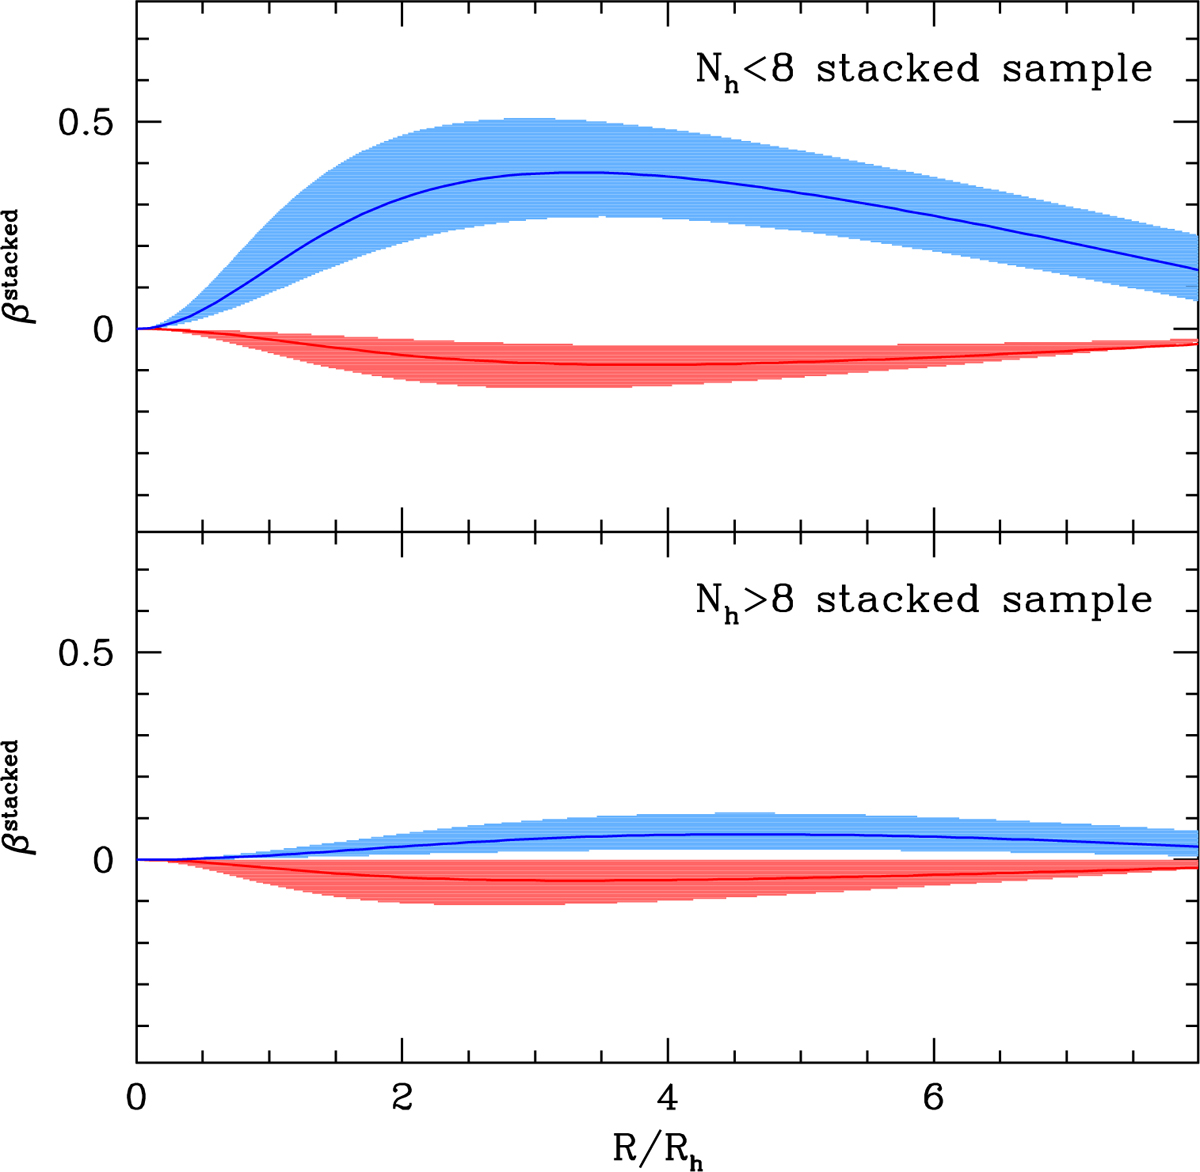
Best-fit results of anisotropy analysis of MPs in the two stacked samples. The upper panel shows the best-fit anisotropy profiles of the FP (red) and SP (blue) subpopulations as obtained for the stacked sample of dynamically young GCs, while the lower panel refers to dynamically old systems.
Current usage metrics show cumulative count of Article Views (full-text article views including HTML views, PDF and ePub downloads, according to the available data) and Abstracts Views on Vision4Press platform.
Data correspond to usage on the plateform after 2015. The current usage metrics is available 48-96 hours after online publication and is updated daily on week days.
Initial download of the metrics may take a while.