Fig. 15
Download original image
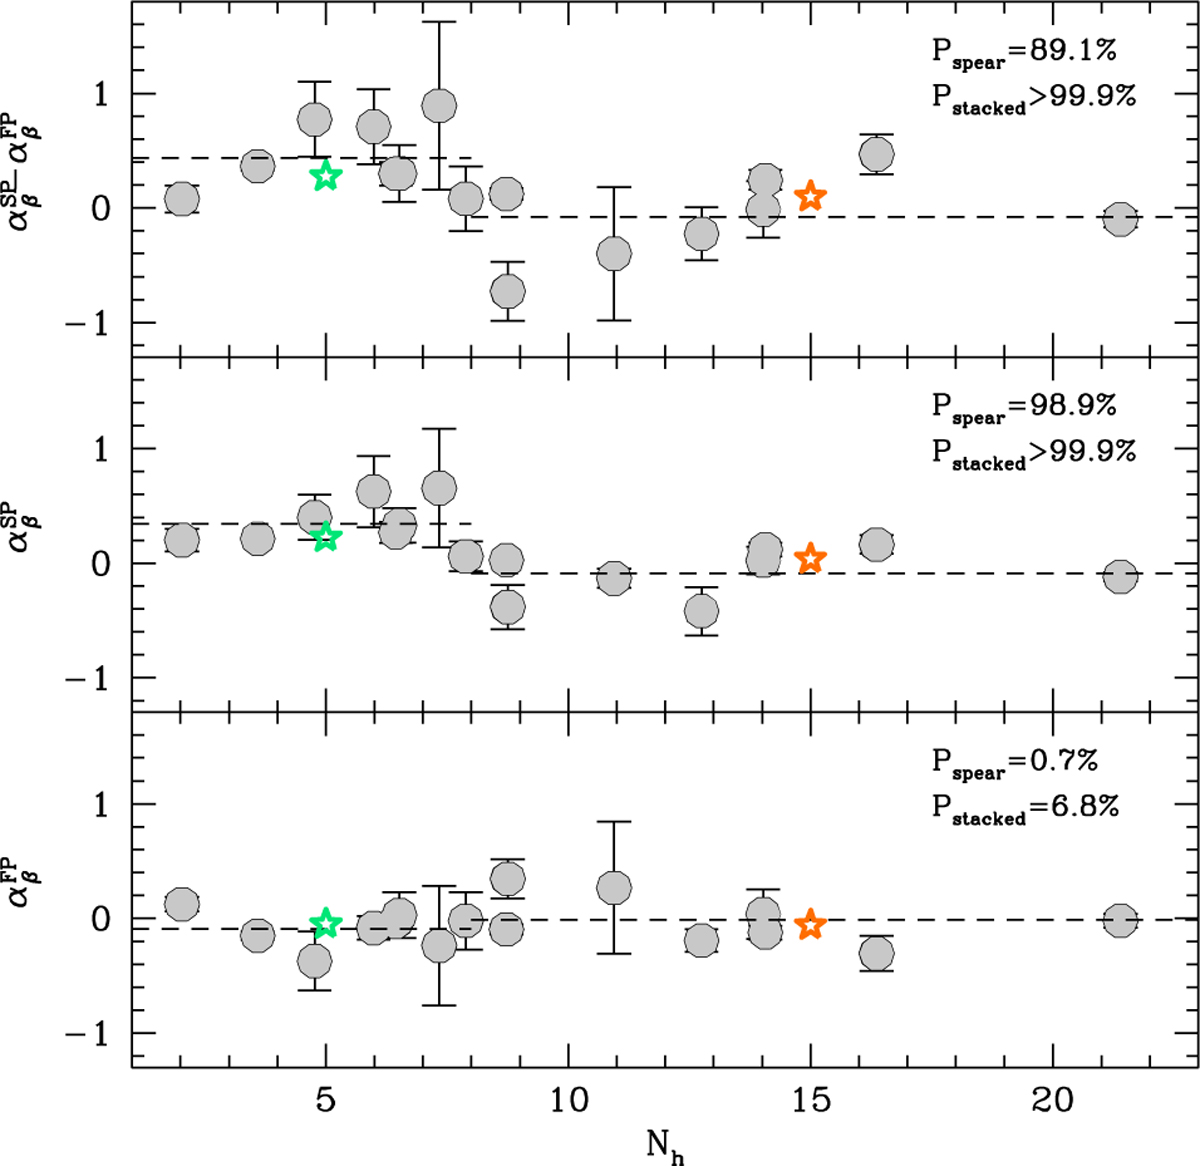
Bottom and middle panels show the distribution of the anisotropy parameter αβ for the FP and SP subpopulations of GCs in the sample (gray circles) as a function of Nh. The top panel shows the differential trend ![]() . The dashed lines represent the mean of the observed αβ values derived for the dynamically young (Nh < 8) and old (Nh > 8) GCs. The star symbols are the result of the analysis on the two stacked samples and their sizes correspond to the errorbars.
. The dashed lines represent the mean of the observed αβ values derived for the dynamically young (Nh < 8) and old (Nh > 8) GCs. The star symbols are the result of the analysis on the two stacked samples and their sizes correspond to the errorbars.
Current usage metrics show cumulative count of Article Views (full-text article views including HTML views, PDF and ePub downloads, according to the available data) and Abstracts Views on Vision4Press platform.
Data correspond to usage on the plateform after 2015. The current usage metrics is available 48-96 hours after online publication and is updated daily on week days.
Initial download of the metrics may take a while.