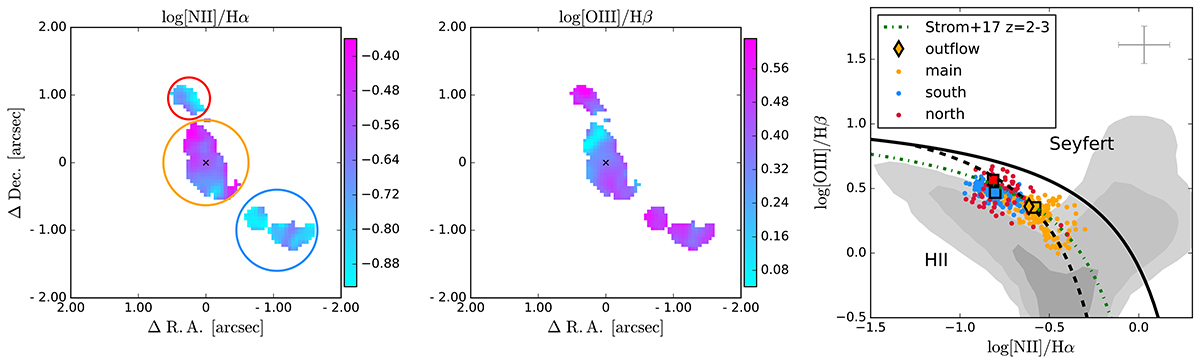
Fig. 9.
Download original image
Spatially resolved maps of the emission line ratios [N II]/Hα and [O III]/Hβ. The circles show the colour-coding for the spaxels in the BPT diagram in the right panel. Right: Emission line diagnostic diagram for the single spaxels. Spaxels belonging to the north, main, and south regions are indicated in red, orange, and light blue, respectively. A representative (median) error bar is shown in the top right. The line ratios derived from the integrated spectra of the three regions are shown with squares. The orange diamond shows the line ratios of the outflow, derived from the broad component of the integrated spectrum of the main target. In black are shown the demarcation lines from Kewley et al. (2001) (solid) and Kauffmann et al. (2003) (dashed). The dashed green line show the locus of star-forming galaxies at z = 2 − 3 from Strom et al. (2017). The location of galaxies from the SDSS sample (Abazajian et al. 2009) is illustrated with the grey contours showing the 50th, 90th, and 98th percentiles of the sample.
Current usage metrics show cumulative count of Article Views (full-text article views including HTML views, PDF and ePub downloads, according to the available data) and Abstracts Views on Vision4Press platform.
Data correspond to usage on the plateform after 2015. The current usage metrics is available 48-96 hours after online publication and is updated daily on week days.
Initial download of the metrics may take a while.