Fig. 8.
Download original image
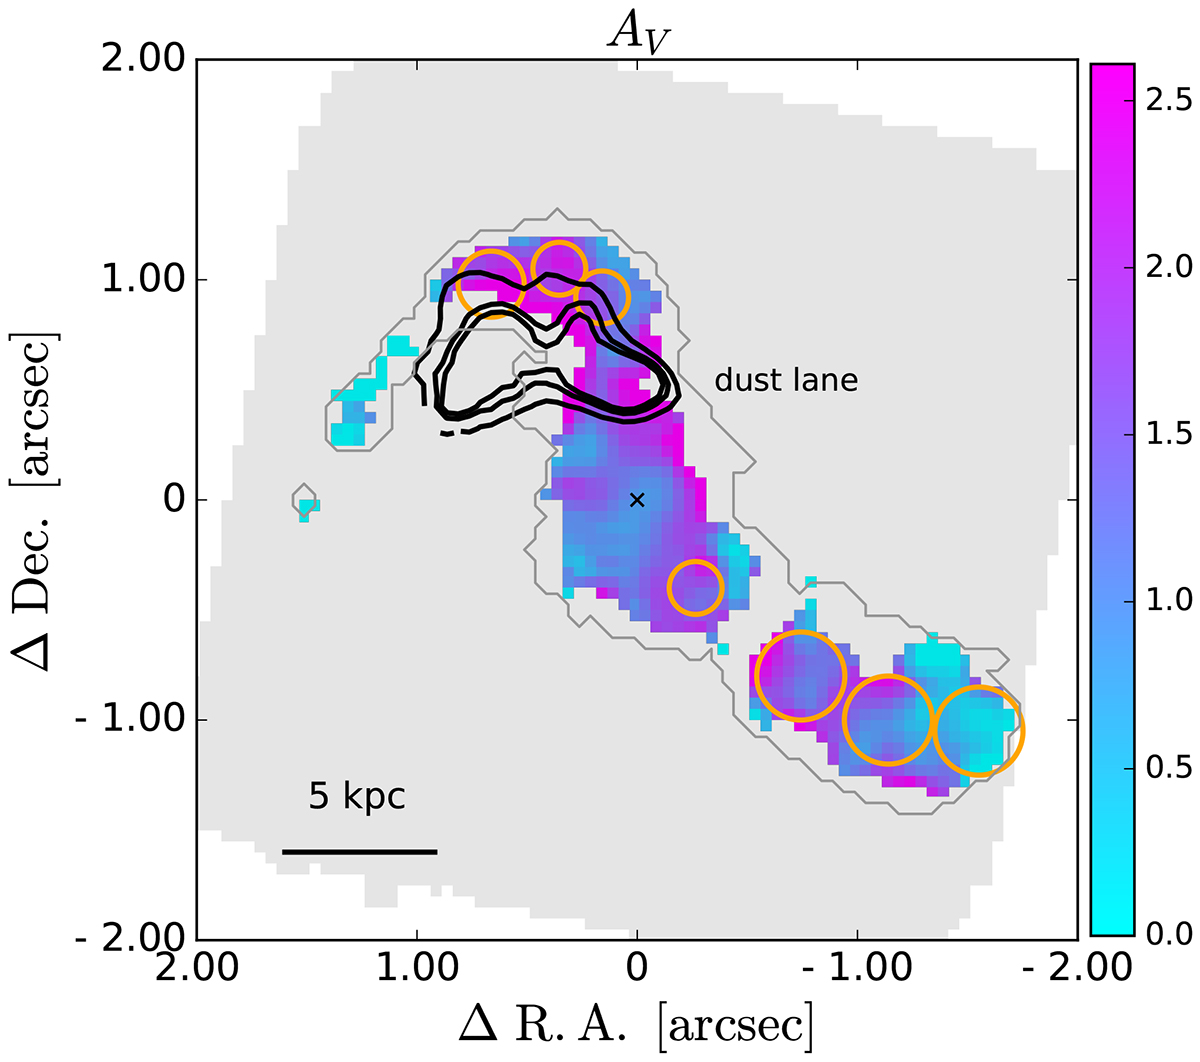
Visual attenuation map inferred from the Hα/Hβ line ratio, using the Cardelli et al. (1989) reddening law. We show spaxels with S/N(Hα) > 3 and S/N(Hβ) > 2. Black contours indicates the dust lane identified in the map ratio of the NIRCam F444W/F090W filters. Orange circles indicate the position of the components identified in Fig. 1. The grey contour indicate the region where Hα is detected with S/N > 3.
Current usage metrics show cumulative count of Article Views (full-text article views including HTML views, PDF and ePub downloads, according to the available data) and Abstracts Views on Vision4Press platform.
Data correspond to usage on the plateform after 2015. The current usage metrics is available 48-96 hours after online publication and is updated daily on week days.
Initial download of the metrics may take a while.