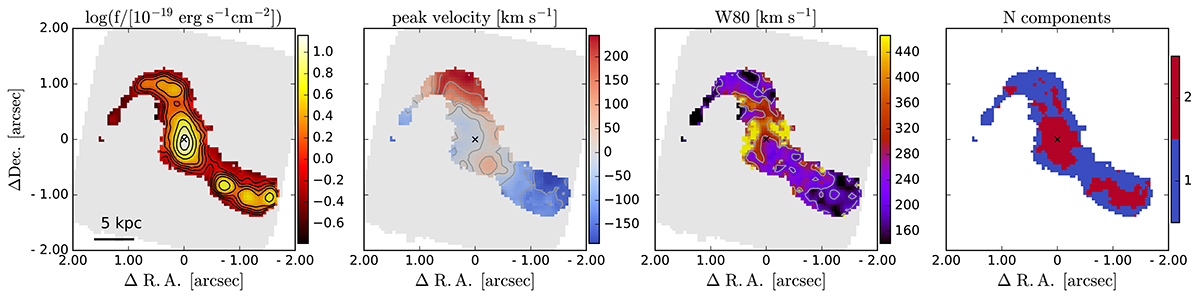
Fig. 4.
Download original image
Maps of the observed Hα emission obtained from the emission line fit with the best-model (with one or two Gaussian components). The number of components used for the fit in each spaxel is indicated in the right panel. Only spaxels with peak S/N > 3.5 in the Hα line are shown. From left to right: integrated observed flux (not corrected for obscuration), velocity at the peak of the emission, line width W80 (width encompassing 80% of the flux, derived from the total line profile), number of Gaussian components used in the fit. Contours in the flux map show the [20, 40, 60, 80, 90] percentiles; contours in the velocity map start at –150 km s−1 and increase every 50 km s−1; contours in the W80 map are at [200, 300, 400] km s−1.
Current usage metrics show cumulative count of Article Views (full-text article views including HTML views, PDF and ePub downloads, according to the available data) and Abstracts Views on Vision4Press platform.
Data correspond to usage on the plateform after 2015. The current usage metrics is available 48-96 hours after online publication and is updated daily on week days.
Initial download of the metrics may take a while.