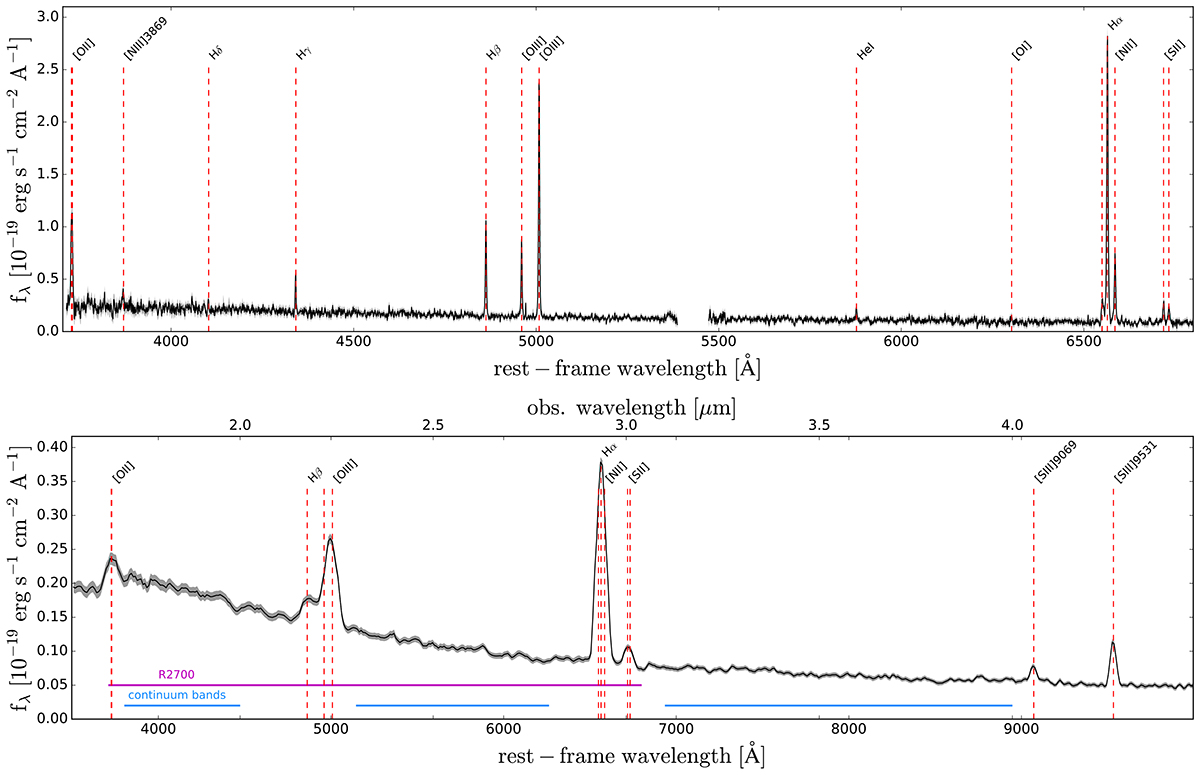
Fig. 2.
Download original image
Average rest-frame spectrum of the main galaxy central 3 × 3 spaxels (0.15″ × 0.15″), from the high-resolution (R ∼ 2700, upper) and low-resolution (R ∼ 100, lower) NIRSpec data. The aperture was chosen as it is representative of the aperture used for the spaxel-by-spaxel fit. For R100, only the portion of the spectrum with the lines of interest is shown. Vertical dashed lines mark the position of the detected emission lines. The shaded grey area shows the error on the fluxes. The magenta line in the R100 panel shows the wavelength range covered by the R2700 data. The light blue lines show the wavelength ranges used to create the continuum maps shown in Fig. 3.
Current usage metrics show cumulative count of Article Views (full-text article views including HTML views, PDF and ePub downloads, according to the available data) and Abstracts Views on Vision4Press platform.
Data correspond to usage on the plateform after 2015. The current usage metrics is available 48-96 hours after online publication and is updated daily on week days.
Initial download of the metrics may take a while.