Fig. 13.
Download original image
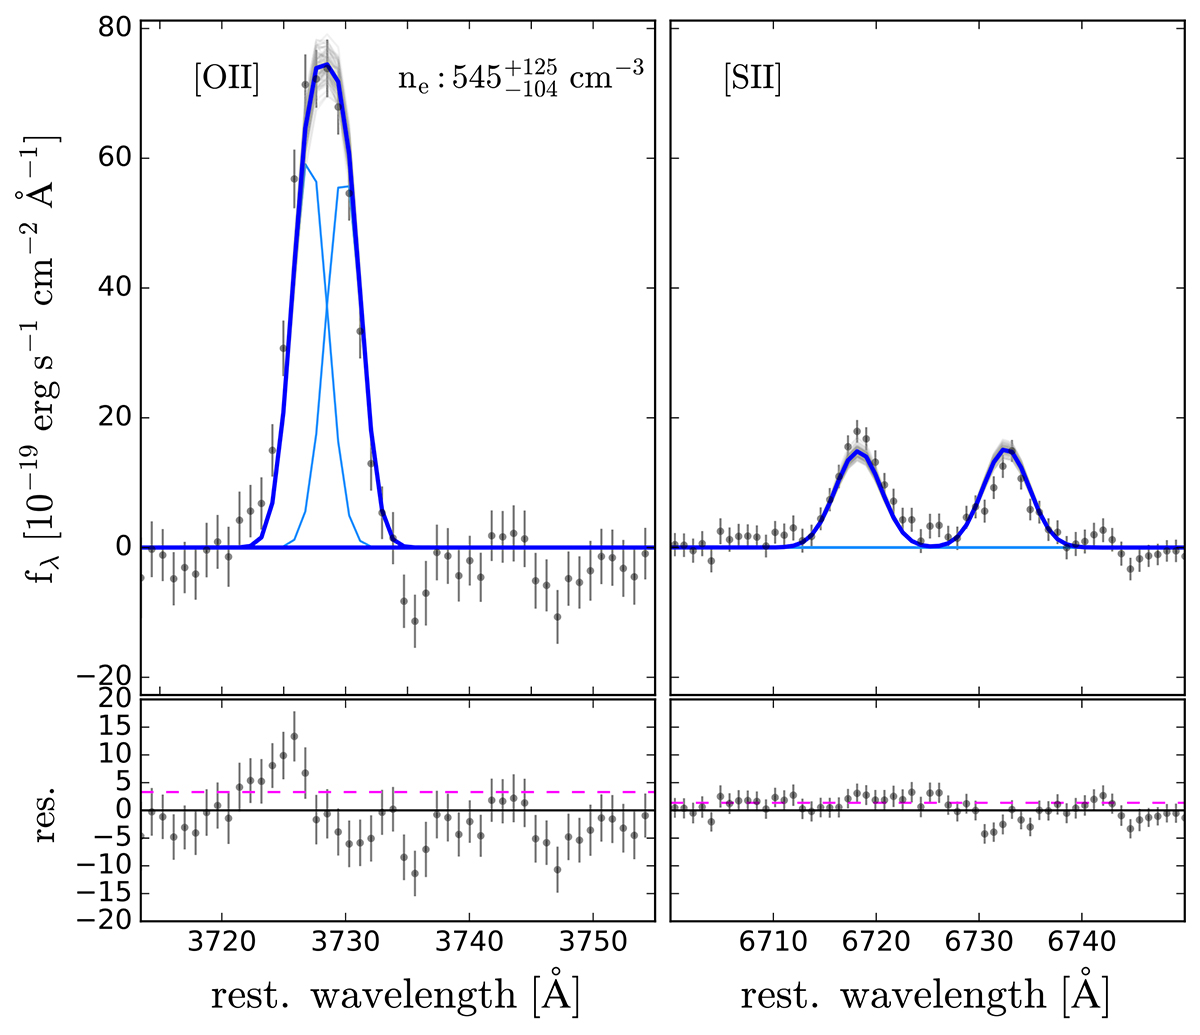
Simultaneous spectral fit of the [O II]λλ3726, 29 and [S II]λλ6716, 31 doublets to derive the electron density from the integrated spectrum of the main target. The blue curve shows the total best-fit model, the light blue curves show the best-fit Gaussians for the individual emission lines, and the grey curves the uncertainties of the MCMC fit. The bottom panels show the residuals, the dashed magenta line indicates the average 1σ noise level.
Current usage metrics show cumulative count of Article Views (full-text article views including HTML views, PDF and ePub downloads, according to the available data) and Abstracts Views on Vision4Press platform.
Data correspond to usage on the plateform after 2015. The current usage metrics is available 48-96 hours after online publication and is updated daily on week days.
Initial download of the metrics may take a while.