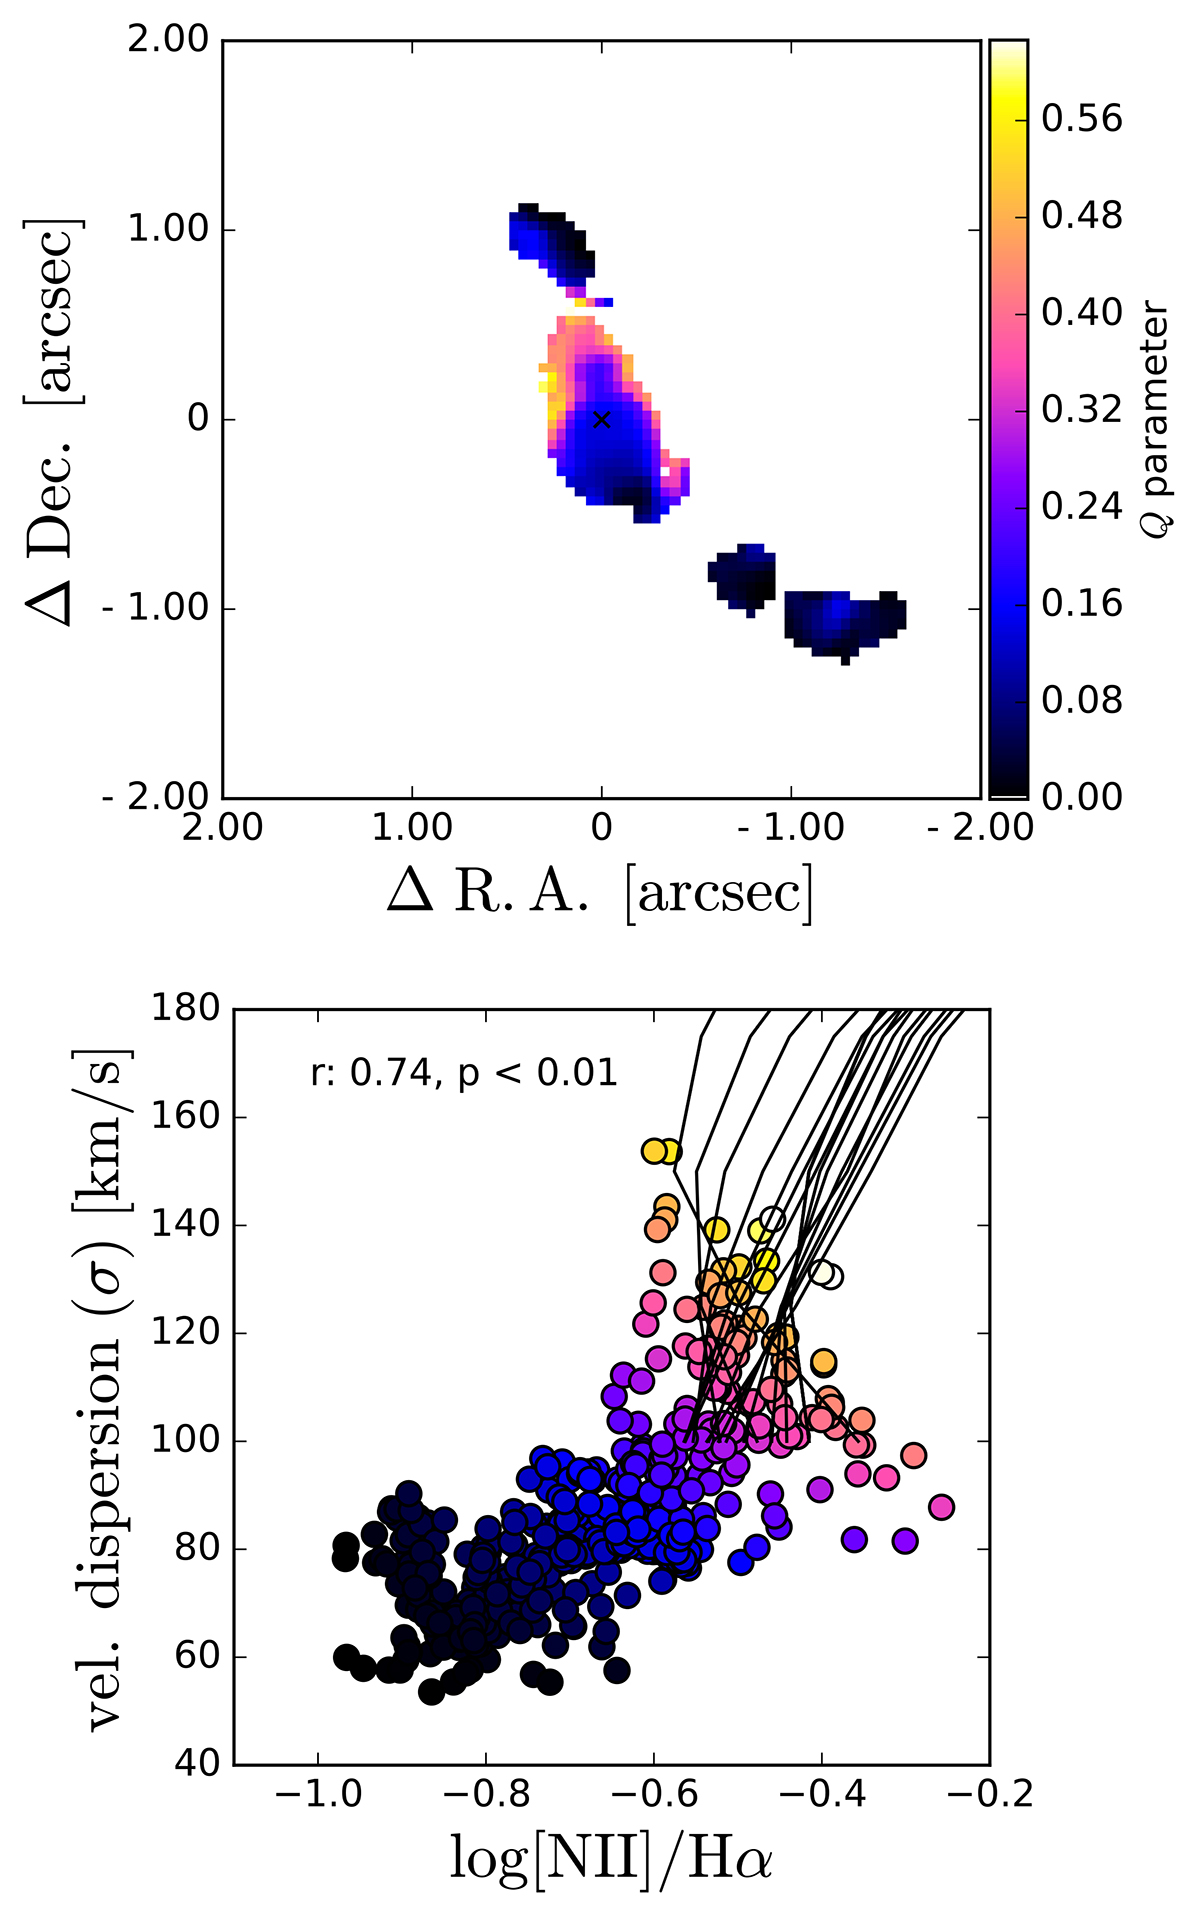
Fig. 10.
Download original image
Comparison of mission line ratio [N II]/Hα and velocity dispersion. Lower panel: Emission line ratio [N II]/Hα versus the velocity dispersion for individual spaxels. Points are colour-coded based on the function Q described in Equation (1), which combines [N II]/Hα and velocity dispersion. Black curves show shock models derived with MAPPINGS V (see text). Upper panel: Map colour-coded as in the lower panel, showing the region with high [N II]/Hα and high velocity dispersion.
Current usage metrics show cumulative count of Article Views (full-text article views including HTML views, PDF and ePub downloads, according to the available data) and Abstracts Views on Vision4Press platform.
Data correspond to usage on the plateform after 2015. The current usage metrics is available 48-96 hours after online publication and is updated daily on week days.
Initial download of the metrics may take a while.