Fig. 8.
Download original image
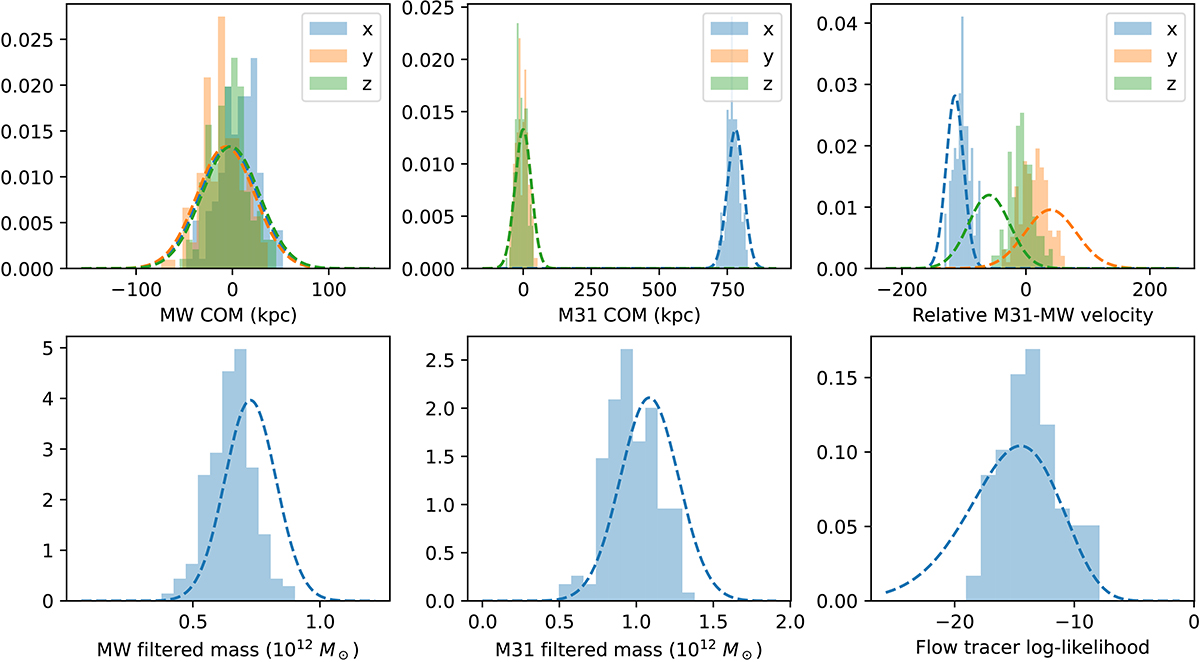
Posterior distributions of LG properties from our Markov chains. In each panel, the histogram is of samples from our chains and therefore indicates the posterior distribution. The dashed lines are the injected observational constraints. The top left panel indicates the centre-of-mass position of the Milky Way, and the top middle panel M31. The right panel shows the relative velocity of the MW-M31 pair. The bottom left and middle panels indicate the 100 kpc filtered masses of the Milky Way and M31. The bottom right panel shows the total log-likelihood of the flow tracers, with on top the χ2-distribution (scaled by ![]() , since the log-likelihood is −χ2/2). These histograms are of the ‘semi-independent’ set of simulations as described in Section 3.3.
, since the log-likelihood is −χ2/2). These histograms are of the ‘semi-independent’ set of simulations as described in Section 3.3.
Current usage metrics show cumulative count of Article Views (full-text article views including HTML views, PDF and ePub downloads, according to the available data) and Abstracts Views on Vision4Press platform.
Data correspond to usage on the plateform after 2015. The current usage metrics is available 48-96 hours after online publication and is updated daily on week days.
Initial download of the metrics may take a while.