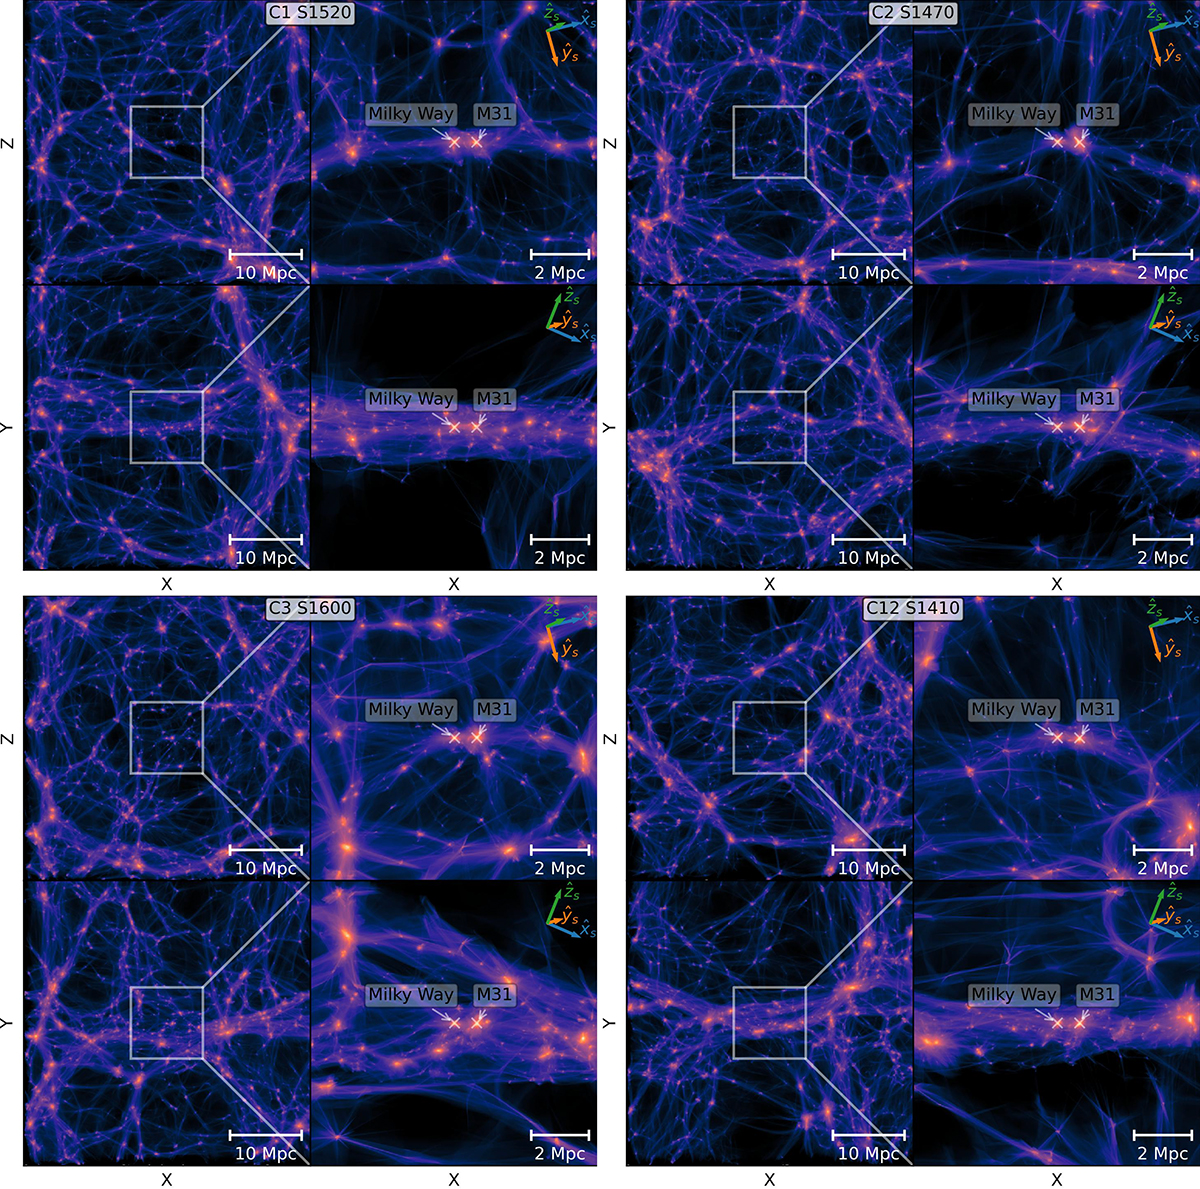
Fig. 7.
Download original image
Final density fields in simulation coordinates of evolution from four of our independent sets of initial conditions (each from a different chain). Each pane corresponds to a single set of initial conditions. Within each pane, the left column shows the full box and the right column the central 10 Mpc zoom box, while the two rows show orthogonal projections. The name at the top of each pane indicates the chain it came from (after C), and its sample index (after S). The visualisations are made using the Lagrangian Sheet density estimation method of the r3d package* (Powell & Abel 2015). The unit vectors of the Supergalactic reference frame are shown at the top right of each high-resolution panel. (* Since our two-grid initial condition layout is not a pure cubic grid, in particular, at the zoom-region boundary, we cannot use the recipe where every cube is divided into 6 tetrahedra as in e.g. Abel et al. (2012). Instead, we use a Delaunay tetrahedralisation to create the simplex tracers.)
Current usage metrics show cumulative count of Article Views (full-text article views including HTML views, PDF and ePub downloads, according to the available data) and Abstracts Views on Vision4Press platform.
Data correspond to usage on the plateform after 2015. The current usage metrics is available 48-96 hours after online publication and is updated daily on week days.
Initial download of the metrics may take a while.