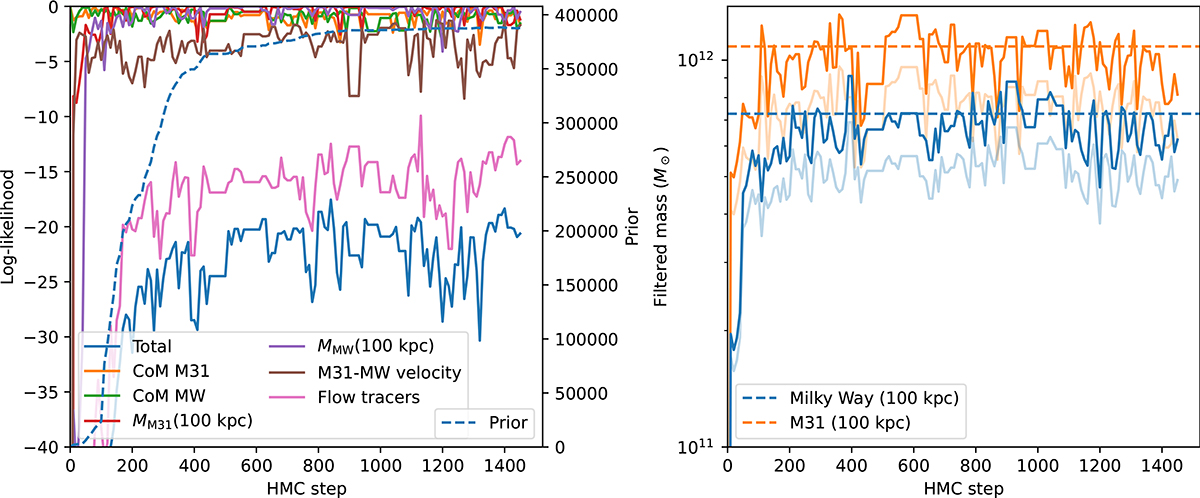
Fig. 4.
Download original image
Trace plots of an example chain, chain number 10. Left: the likelihood values of the observational constraints. The solid blue line is the total likelihood, which is the sum of all other solid lines that indicate components of the likelihood. The dashed lines are the prior on the initial white noise fields sLR and sHR. Right: The masses of the Milky Way and M31 along the chain. The greyed-out lines indicate values of the masses before applying the correction from Figure C.1. This particular chain was considered warmed up by sample 760 according to the criterion of Section 3.3.
Current usage metrics show cumulative count of Article Views (full-text article views including HTML views, PDF and ePub downloads, according to the available data) and Abstracts Views on Vision4Press platform.
Data correspond to usage on the plateform after 2015. The current usage metrics is available 48-96 hours after online publication and is updated daily on week days.
Initial download of the metrics may take a while.