Fig. 3.
Download original image
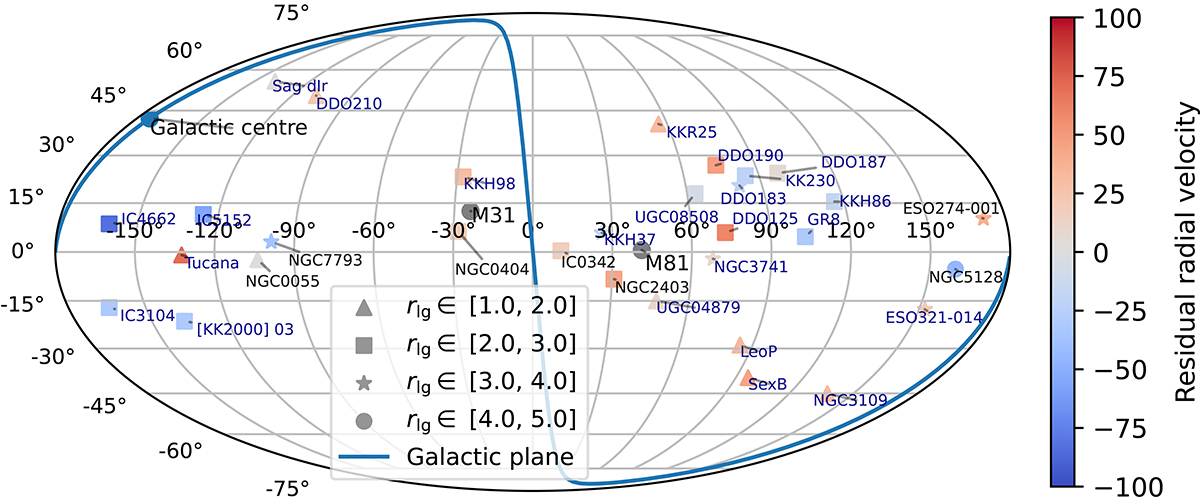
Sky distribution in Supergalactic coordinates of the catalogue of the galaxies used as flow tracers in this analysis. Symbol type indicates distance from the LG’s barycentre, and colour indicates velocity with respect to the spherical model shown as a red line in Figure 2. Units are in Mpc and km s−1. The blue line shows the Galactic plane.
Current usage metrics show cumulative count of Article Views (full-text article views including HTML views, PDF and ePub downloads, according to the available data) and Abstracts Views on Vision4Press platform.
Data correspond to usage on the plateform after 2015. The current usage metrics is available 48-96 hours after online publication and is updated daily on week days.
Initial download of the metrics may take a while.