Fig. 2.
Download original image
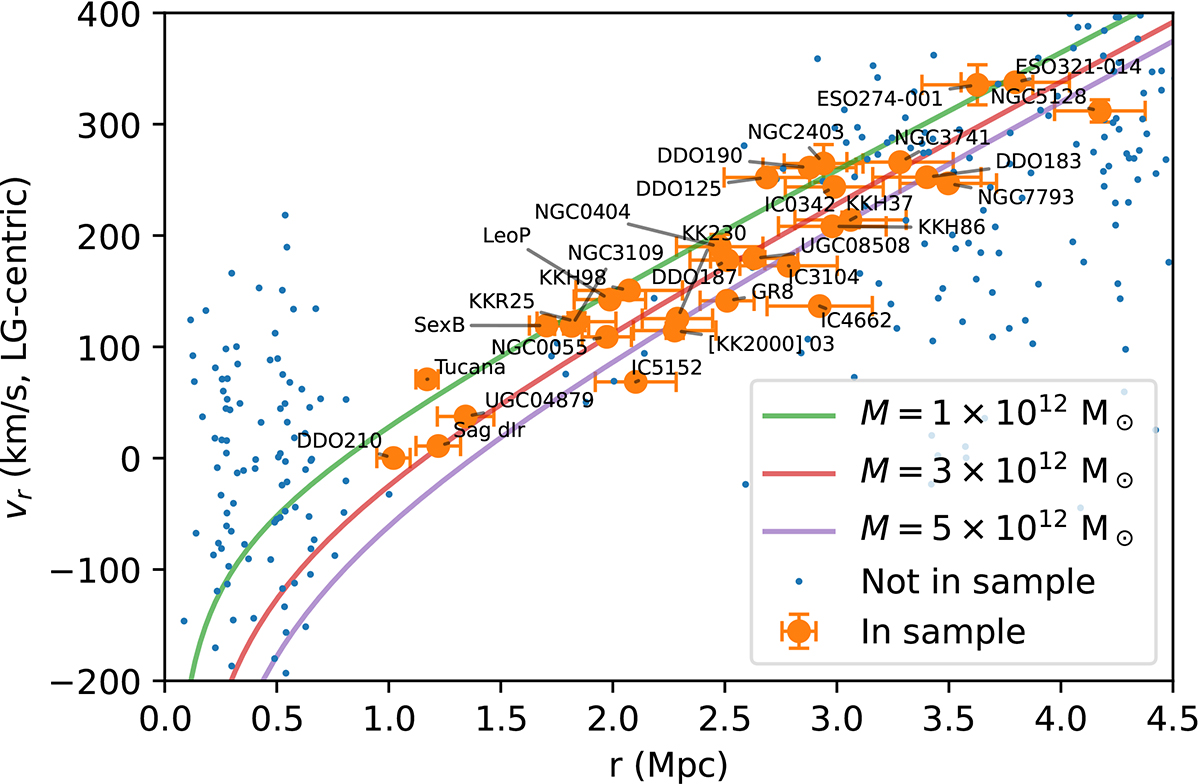
The catalogue of galaxies used as flow tracers in this analysis, analogous to Fig. 11 in Peñarrubia et al. (2014). The x-axis is the Local-Group-centric distance, where the centre of the LG is the centre of mass of the Milky Way-M31 pair when assuming a mass ratio of MM31/MMW = 2. The y-axis is the radial velocity projected in the LG-centric frame, where the offset is computed by interpolating the velocity field along the line between the two galaxies linearly. The different lines indicate spherical Kepler-like velocity models of the recession velocity (Equation (9) of Peñarrubia et al. 2014).
Current usage metrics show cumulative count of Article Views (full-text article views including HTML views, PDF and ePub downloads, according to the available data) and Abstracts Views on Vision4Press platform.
Data correspond to usage on the plateform after 2015. The current usage metrics is available 48-96 hours after online publication and is updated daily on week days.
Initial download of the metrics may take a while.