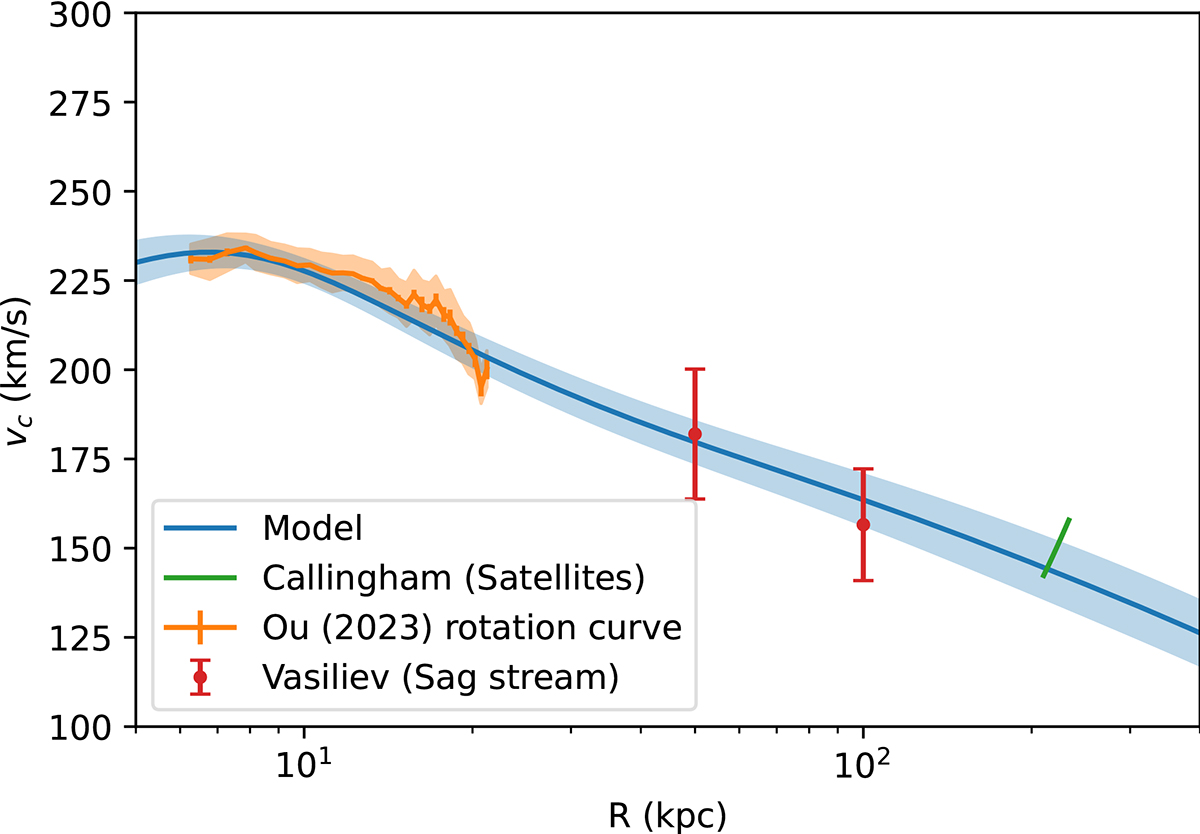
Fig. A.1.
Download original image
Our assumed circular velocity curve for the Milky Way, together with a band showing the 1σ scatter in the posterior distribution of ΛCDM models constrained by the observational data points shown, with their adopted error bars, in orange, red, and green. The solid blue curve is the mean of the posterior circular velocity distribution at each radius. The error bar of the Callingham et al. (2019) estimate is diagonal since they estimated the virial mass and a lower mass results in a lower virial radius.
Current usage metrics show cumulative count of Article Views (full-text article views including HTML views, PDF and ePub downloads, according to the available data) and Abstracts Views on Vision4Press platform.
Data correspond to usage on the plateform after 2015. The current usage metrics is available 48-96 hours after online publication and is updated daily on week days.
Initial download of the metrics may take a while.