Open Access
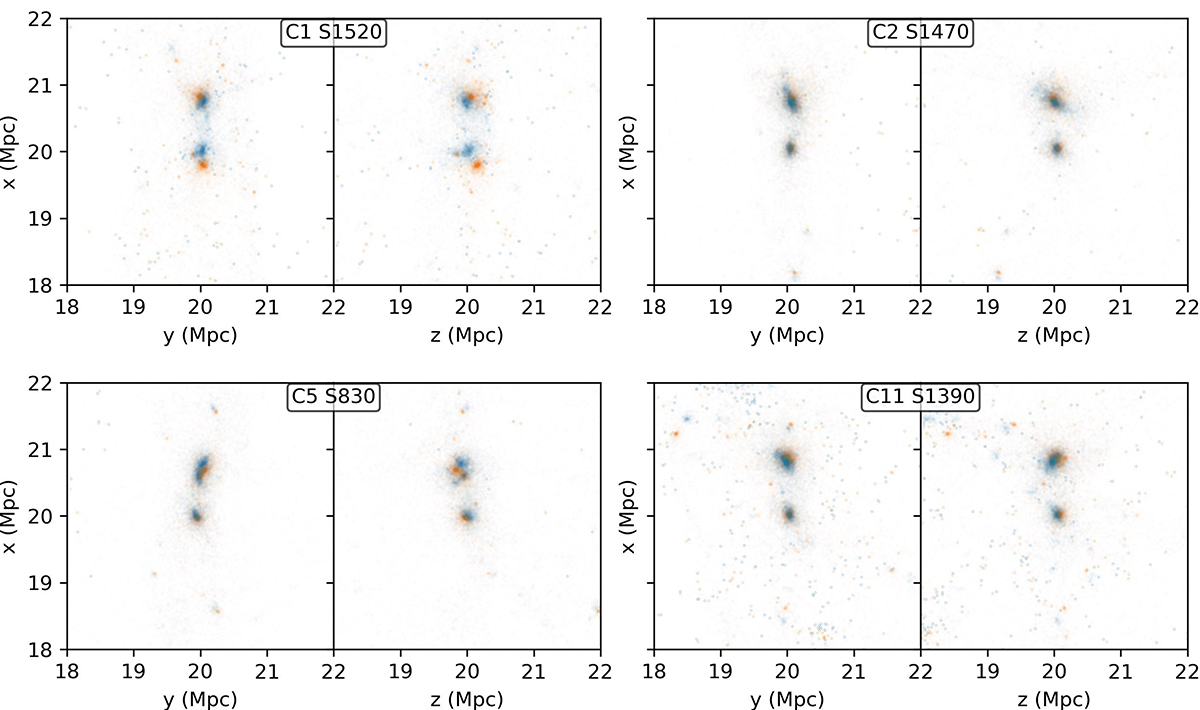
Fig. 11.
Download original image
LG region (a box of (2 Mpc)3 centred at the Milky Way) in some resimulations with Gadget-4. The blue dots indicate particles in the BORG simulations, and the orange dots indicate particles in the gadget re-simulations. Each panel indicates one simulation, with two projections being shown.
Current usage metrics show cumulative count of Article Views (full-text article views including HTML views, PDF and ePub downloads, according to the available data) and Abstracts Views on Vision4Press platform.
Data correspond to usage on the plateform after 2015. The current usage metrics is available 48-96 hours after online publication and is updated daily on week days.
Initial download of the metrics may take a while.