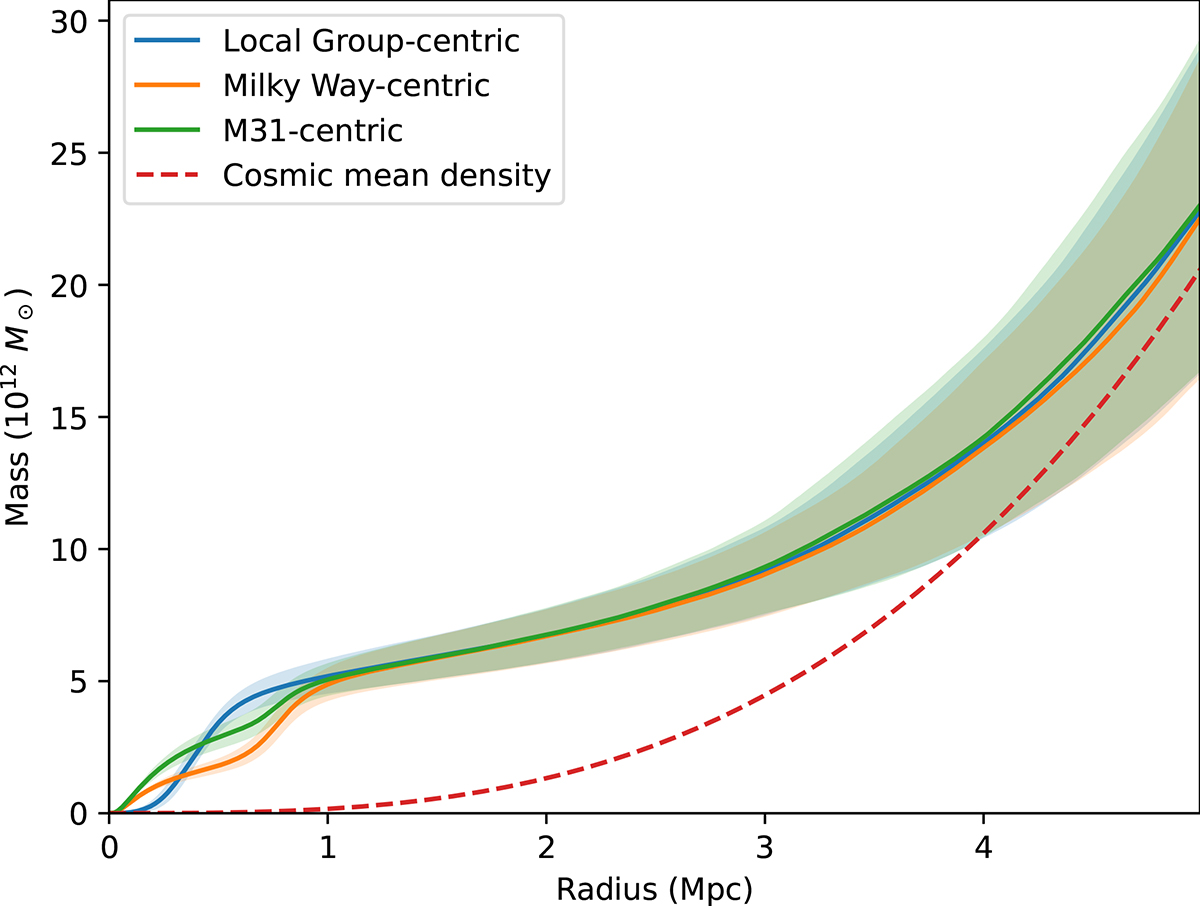
Fig. 10.
Download original image
Enclosed mass profiles in our simulations, centred on the Local Group’s centre of mass, on the Milky Way, and on M31. The lines indicate the posterior mean, and the shaded regions are the 1σ region of the ‘semi-independent’ sample set (see Section 3.3, we use this to avoid being affected by shot noise coming from thinning the chains).
Current usage metrics show cumulative count of Article Views (full-text article views including HTML views, PDF and ePub downloads, according to the available data) and Abstracts Views on Vision4Press platform.
Data correspond to usage on the plateform after 2015. The current usage metrics is available 48-96 hours after online publication and is updated daily on week days.
Initial download of the metrics may take a while.