Fig. 12.
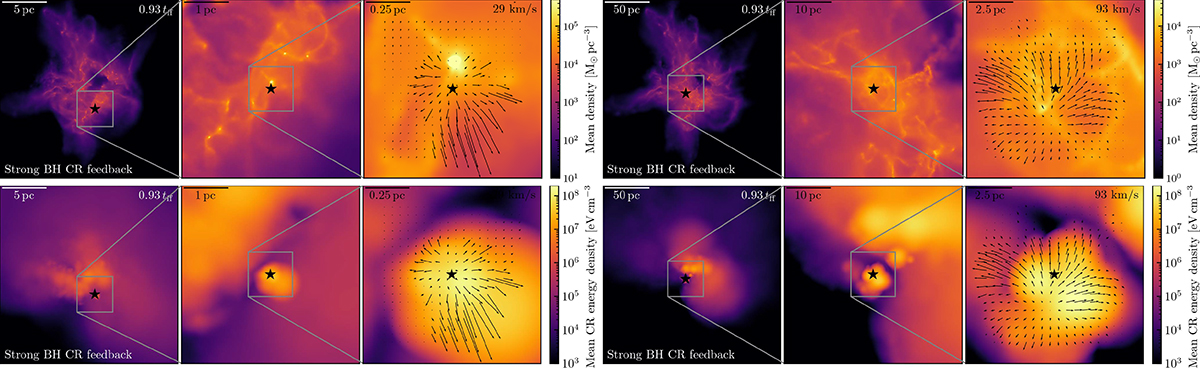
Download original image
Visualization of the GMCs with strong CR feedback, each from a snapshot with rapid BH growth. Left two zoom-in plots: Line-averaged mass density (top) and CR energy density (bottom) near a BH undergoing runaway accretion, based on a 106 M⊙ GMC. We zoom in near the BH, from the left to the right panel, as in Fig. 3. The line-averaged density is evaluated within the box of each panel. We see a high-energy CR bubble generated by the BH. Right two zoom-in plots: Same as the left plots, but embedded in the 108 M⊙ GMC.
Current usage metrics show cumulative count of Article Views (full-text article views including HTML views, PDF and ePub downloads, according to the available data) and Abstracts Views on Vision4Press platform.
Data correspond to usage on the plateform after 2015. The current usage metrics is available 48-96 hours after online publication and is updated daily on week days.
Initial download of the metrics may take a while.