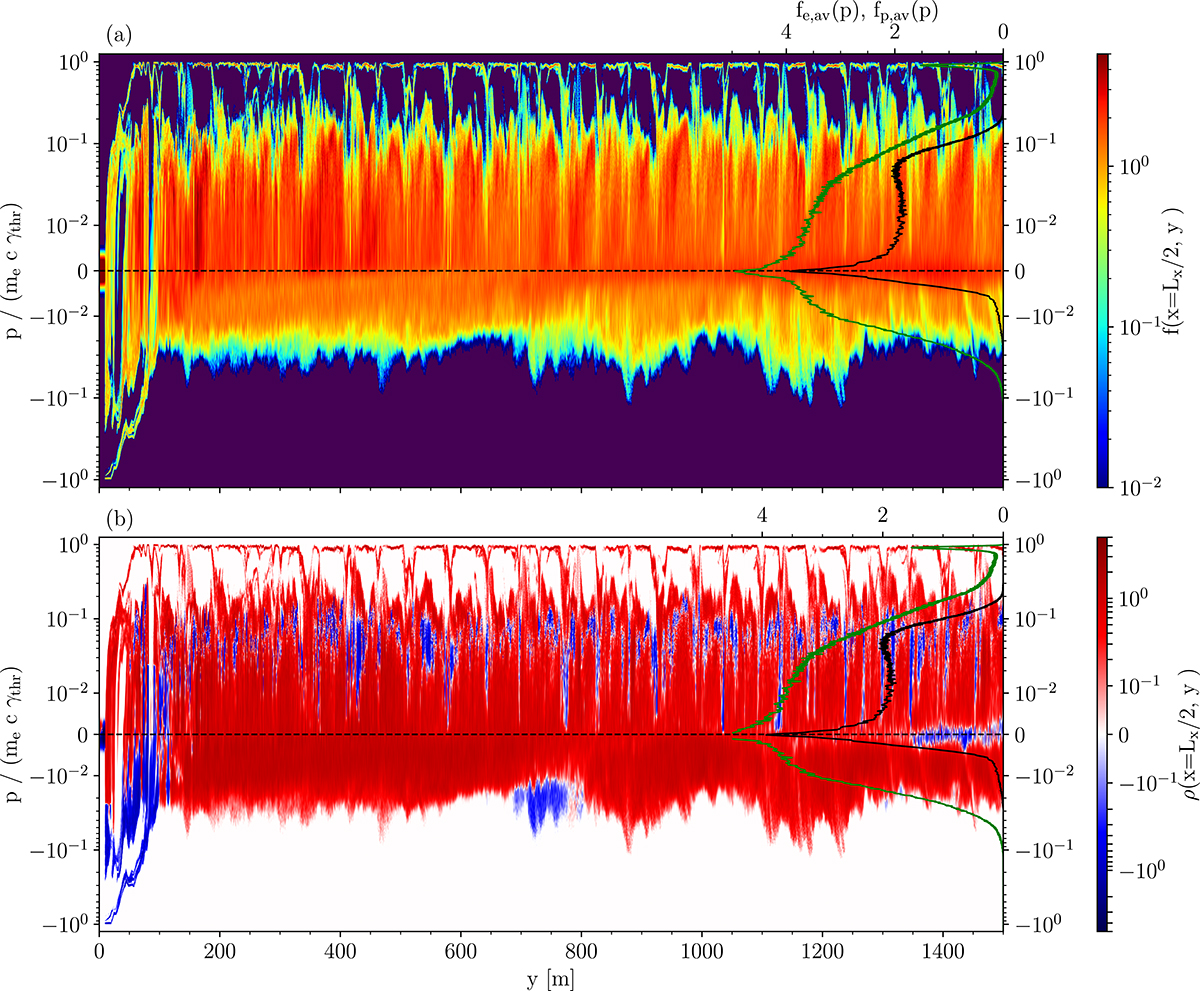
Fig. 7.
Download original image
Particle phase space distributions for the pulsar with ι = 0° along the magnetic dipole axis at x = 0 at the end of the simulation time. Black and green lines: Average particle distributions of electrons fe, av(p) and positrons fp, av(p), respectively, in a distance range of y = 800–1400 m. Top: Particle number density. Bottom: Charge density. The white regions have a zero charge density distribution (if f(r, p)> 0), or there are no particles (if f(r, p)=0).
Current usage metrics show cumulative count of Article Views (full-text article views including HTML views, PDF and ePub downloads, according to the available data) and Abstracts Views on Vision4Press platform.
Data correspond to usage on the plateform after 2015. The current usage metrics is available 48-96 hours after online publication and is updated daily on week days.
Initial download of the metrics may take a while.