Open Access
Fig. 3.
Download original image
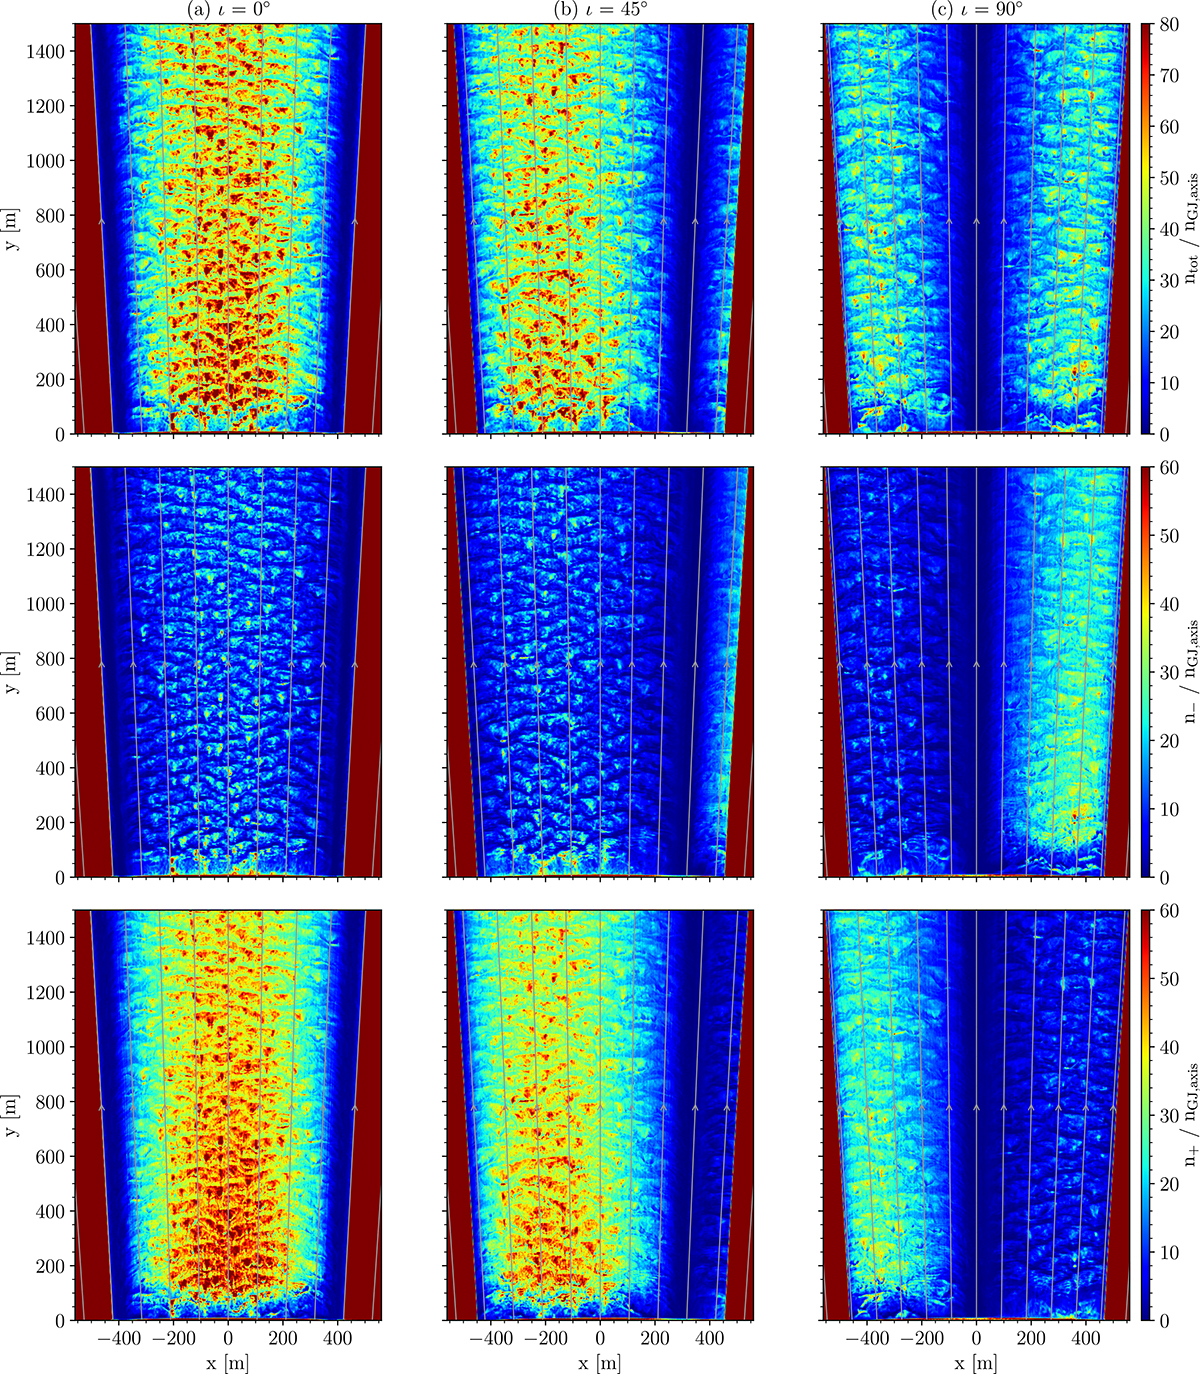
Total (top row), electron (middle row), and positron (bottom row) plasma density at the end of the simulation time normalized to the GJ density, jGJ, axis. The inclination increases from left to right. The magnetic field lines are denoted as gray lines. A video animation is on Zenodo2.
Current usage metrics show cumulative count of Article Views (full-text article views including HTML views, PDF and ePub downloads, according to the available data) and Abstracts Views on Vision4Press platform.
Data correspond to usage on the plateform after 2015. The current usage metrics is available 48-96 hours after online publication and is updated daily on week days.
Initial download of the metrics may take a while.