Fig. 8
Download original image
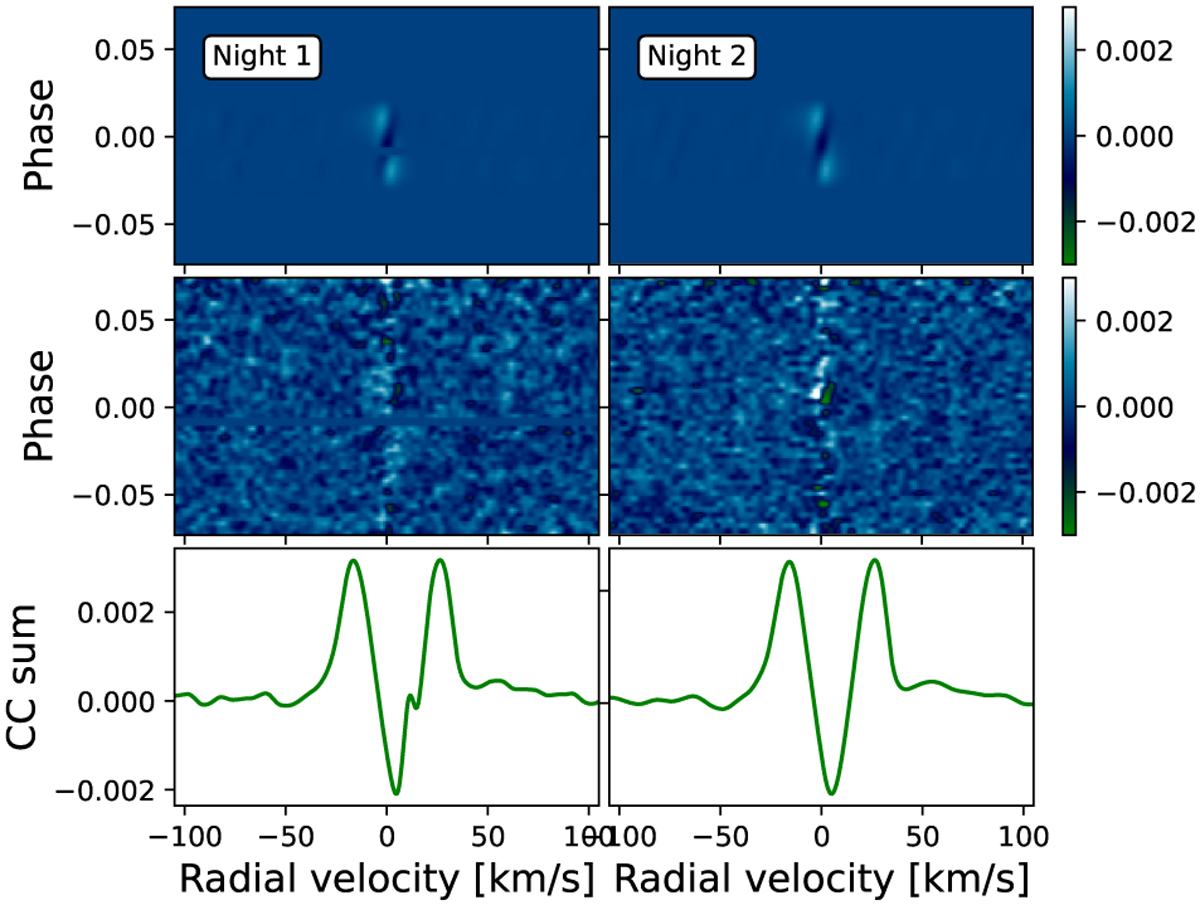
Modeled RM+CLV effects for Fe I for Night 1 and Night 2. In the top plots, we present the modeled RM+CLV effects after cross-correlation with the model of Fe I. In the middle plots, we show the cross-correlation residual plots for Night 1 and Night 2 separately in order to compare the shape of the modeled RM+CLV effects. In the bottom panels, we present the CC, after summing the in-transit data of the RM effect for Kp = 185 km s−1. The feature in the RM+CLV model of Night 1 is due to a gap in the data during the observations.
Current usage metrics show cumulative count of Article Views (full-text article views including HTML views, PDF and ePub downloads, according to the available data) and Abstracts Views on Vision4Press platform.
Data correspond to usage on the plateform after 2015. The current usage metrics is available 48-96 hours after online publication and is updated daily on week days.
Initial download of the metrics may take a while.