Fig. 6
Download original image
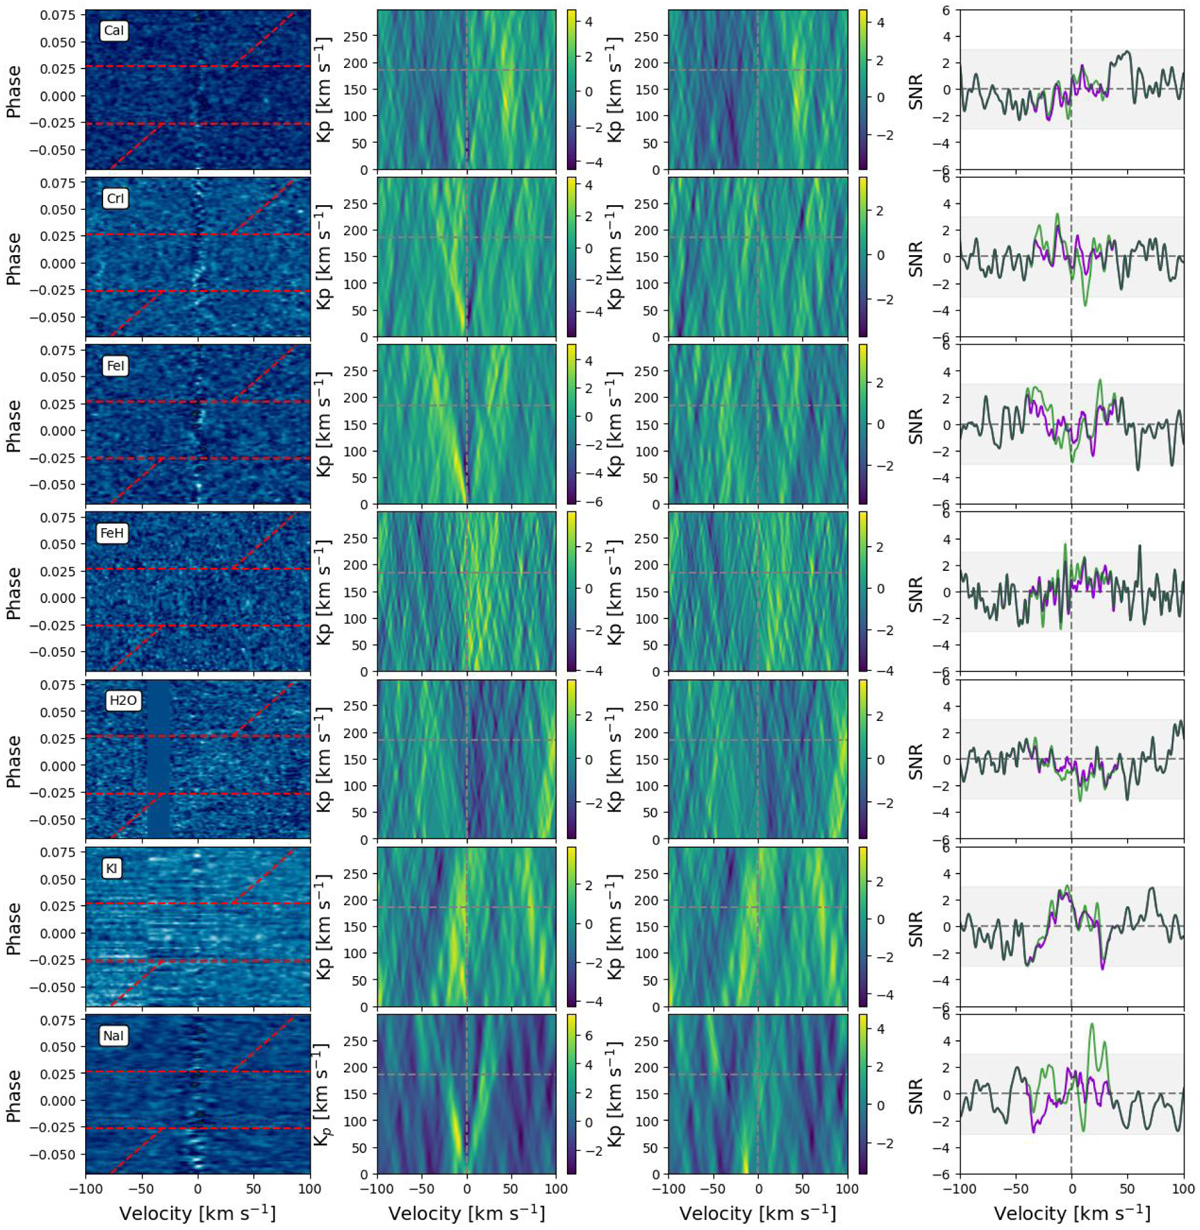
Cross-correlation results for WASP-122b for Ca I, Cr I, Fe I, FeH, H2O, K I, and Na I. For each of the species, we present the following plots. First column: residual map before masking the RM effect, where the red horizontal lines represent the beginning and end of the transit and the red tilted line represents the expected velocity of the planet. Second column: Kp map calculated for a range of 0 to 300 km s–1, the theoretical Kp of the planets is represented by a gray horizontal line. Expected signal from the planet should be detected at Kp =185 km s−1 and radial velocity 0 km s−1. Third column: same as the second column but after masking the RM effect. Fourth column: S/N plot for theoretical Kp value. The green plot is the raw S/N plot and the purple plot is S/N after masking the regions where the RM effect appears. The horizontal gray dashed line represents S/N = 0, and the vertical gray dashed line represents the radial velocity of 0 km/s, which is the expected position of the CC peak. The gray regions represent S/N between −3 and 3.
Current usage metrics show cumulative count of Article Views (full-text article views including HTML views, PDF and ePub downloads, according to the available data) and Abstracts Views on Vision4Press platform.
Data correspond to usage on the plateform after 2015. The current usage metrics is available 48-96 hours after online publication and is updated daily on week days.
Initial download of the metrics may take a while.